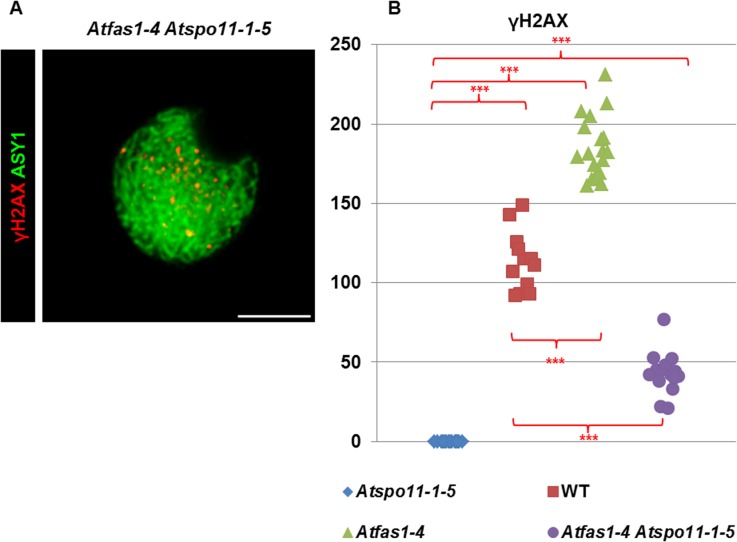
Fig 5. DSB formation in Atfas1-4, Atspo11-1-5, and in the double mutant Atfas1-4 Atspo11-1-5.
(A) Dual immunolocalization of AtASY1 (green) and γH2AX (red) in Atfas1-4 Atspo11-1-5. Bar = 5 µm. (B) Quantification of γH2AX foci in the different backgrounds. Each dot is the count from a single nucleus. P values are from two-sided Wilcoxon Mann-Whitney tests (***P < 0.001).

