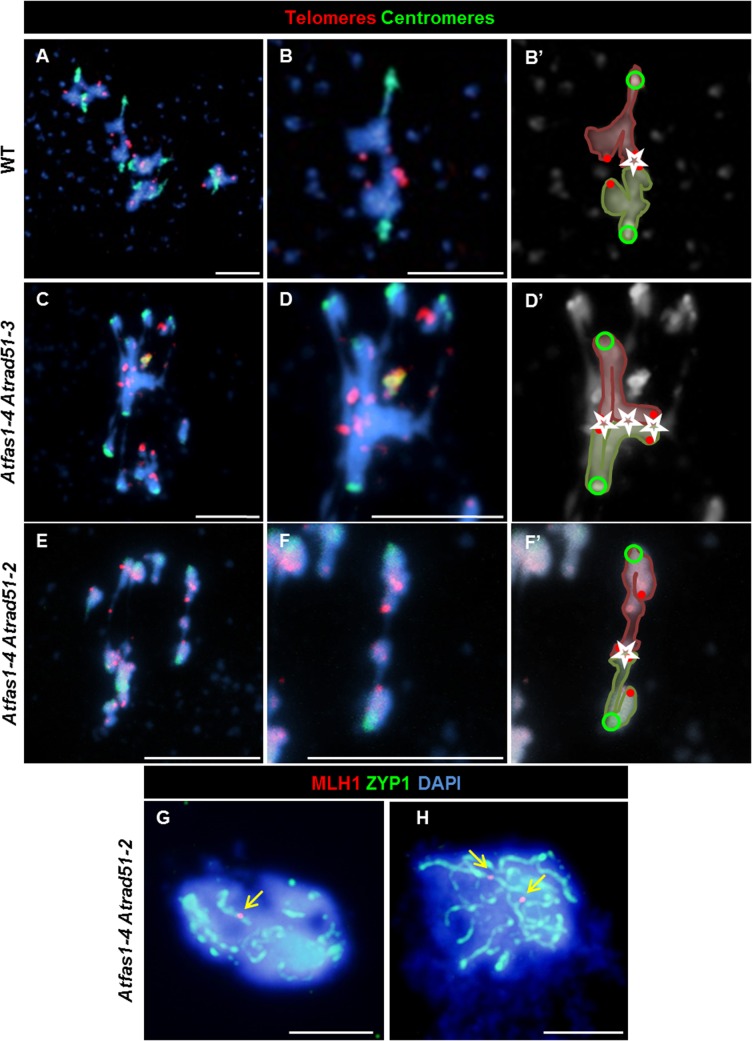
Fig 7. Atrad51 mutants display truly COs.
(A-F) FISH of metaphase I spreads of WT, Atfas1-4 Atrad51-3 and Atfas1-4 Atrad51-2 PMCs using telomeric (red) and centromeric (green) probes. (A) WT metaphase I. (B, B’) Magnification of one bivalent from (A). The external localization of the telomeres (red dots) shows a chiasmatic association (star) between two bioriented homologous chromosomes (centromeres are represented as green circles). Representative images of metaphase I cells from (C) Atfas1-4 Atrad51-3 and (E) Atfas1-4 Atrad51-2. (D, D’, F, F’) Bivalent magnification and diagrammatic chiasma interpretation. (G, H) CO confirmation (arrow) in Atfas1-4 Atrad51-2 detected by immunolocalization of AtMLH1 (red) and AtZYP1 (green) and counterstained with DAPI (blue). Bars = 5 µm.

