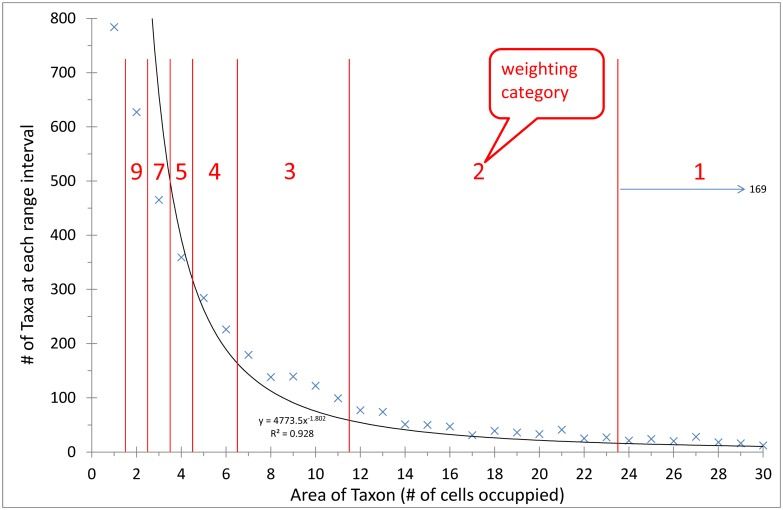
Fig 2. A histogram of the number of taxa in each of the taxon area sizes.
The 4 304 taxa analysed were divided into bins dependent on the number of cells they occupied, and the frequency in each bin was calculated. A regression line was then plotted between the bin size and its taxon number. The regression line, graph equation (used for integration), and the goodness of fit value (R2) are indicated on the graph.

