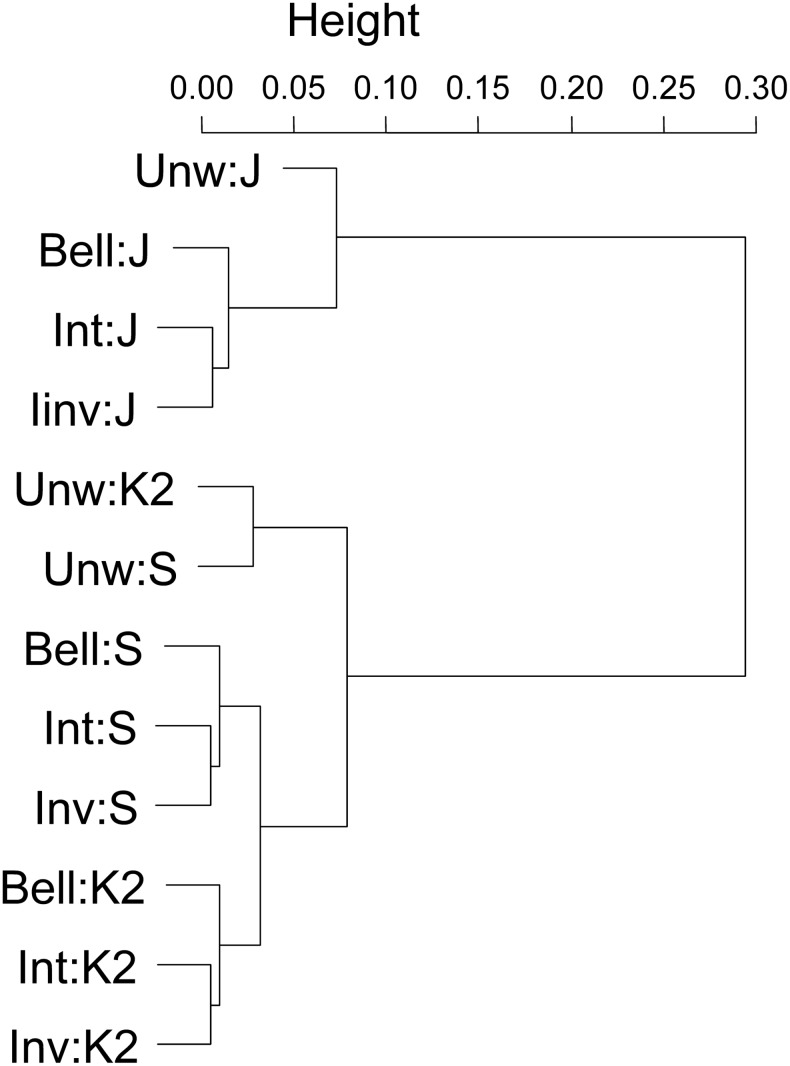
Fig 5. A dendrogram of the correlation between the 12 weighting-dissimilarity matrices.
Mantel Tests were undertaken using Pearson correlation and 999 permutations. The actual correlation values are provided in S2 Table. All dissimilarity matrices were significantly correlated with p < 0.001. [Unw = unweighted, Bell = Bell weighting, Int = Integration weighting, Inv = Inverse weighting, K2 = Kulczinsky2; J = Jaccard; S = Simpson].

