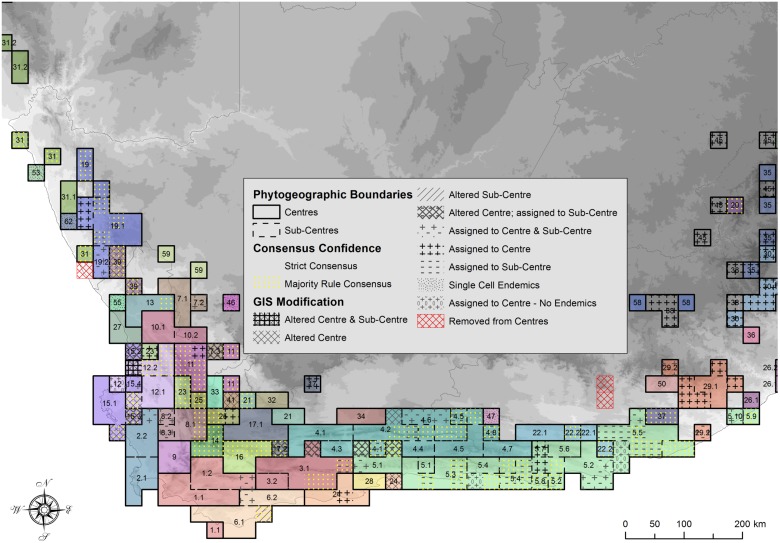
Fig 7. Spatial summary of the methods used for demarcating biogeographic areas.
The relative robustness of the CoEs / Sub-CoEs identified in the CFR are indicated. The most robust CoEs / Sub-CoEs were retrieved by the strict consensus analysis (indicated without any patterning). These are followed in robustness by areas retrieved by the slightly less rigorous majority rule consensus (yellow dots). Post GIS modification then refined these initial candidates, altering cell assignment in CoEs (cross hatching) and Sub-CoEs (diagonal hatching). Cells not assigned due to conflict in clustering or consensus were then added to CoEs (+) or to Sub-CoEs (-), whereas single cell endemics that did not group with other cells were also indicated (fine dots). CoEs retrieved by clustering of taxa with very widespread distributions indicating uncertain collection effort were removed (red cross hatching). Finally, cells assigned to CoEs to bridge the gap between CoEs and BRs are indicated with +0, indicating no endemic taxa.

