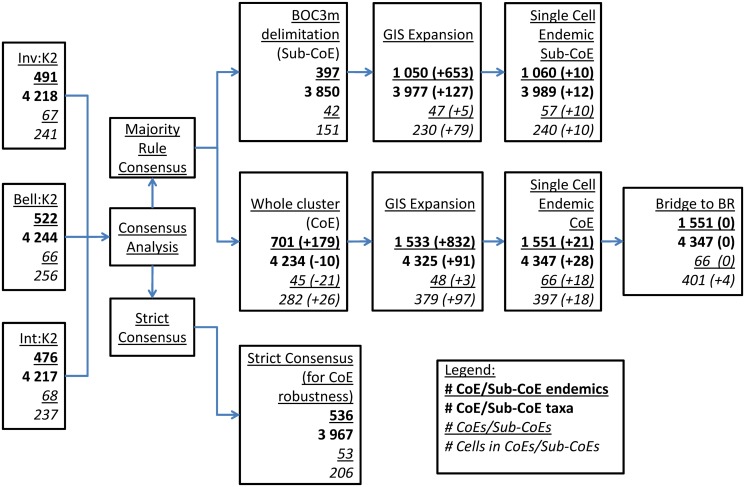
Fig 8. Flow chart summary of the change in CoE properties from clustering to GIS interrogation.
CoE properties (endemic taxa, richness, number and size of CoEs / Sub-CoEs) of the best clustering technique results (Inv:K2, Bell:K2 & Int:K2), showing the effects of applying majority rule and strict consensus on CoE/Sub-CoE properties are depicted (the legend indicates what each number row refers to in each block). Also displayed are the improvements of CoE / Sub-CoE properties with GIS interrogation (the values in brackets indicate additional taxa or cells added to CoEs). Finally, the minimal changes required in CoE properties are reported when converting CoEs to BRs.

