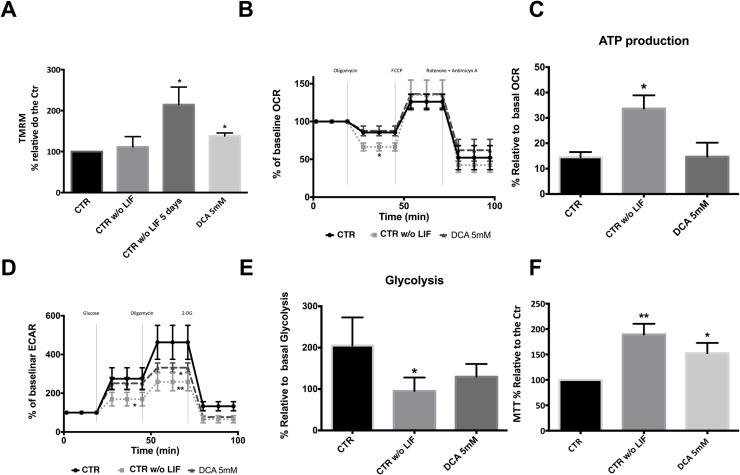
Fig 3. Assessing mitochondrial function.
For each flow cytometry experiment results were analyzed in terms of Geometric Mean of Fluorescence for 20000 cells for each condition and are represented as percentage relative to the control. (A)- Quantification of mitochondrial membrane potential (MMP) potential using TMRM by flow cytometry. A significant increase in MMP was observed for CTR w/o LIF as well as for DCA 5 mM. Results are means ± SEM of 4 independent experiments. (B)- Oxygen consumption rate (OCR) was determined using the Seahorse XF24 analyzer. The three mitochondrial inhibitors were sequentially injected (after measurement points, 2, 4, and 6, as indicated) and the final concentrations of each were: oligomycin (1μM); FCCP (300mM); rotenone and antimicyn A (1μM). CTR w/o LIF presented a significant decrease in OCR in the presence of oligomycin. (C)- Determination of the respiration used to drive ATP production under basal conditions following the mathematical calculation: ATP production = Basal–Protocol Leak. This formula determines that CTR w/o LIF cells had higher mitochondrial respiration coupled to ATP production (D)- Measurement of extracellular acidification rate (ECAR) using the Seahorse XF24 analyzer. Cells were incubated in a medium without glucose and ECAR was accessed during consumption of Glucose (added at the third time point at a final concentration of 5mM) and in the presence of oligomycin (1μM added at the sixth point) and 2DG (10mM at the ninth point). At basal conditions, CTR w/o LIF had a lower glycolytic rate when compared to the control. The CTR condition displayed a significant higher glycolytic capacity. (E)- Determination of glucose breakdown to pyruvate using the mathematical calculation: first measurement after glucose injection minus the measurement prior to glucose injection. CTR w/o LIF cells had a significantly lower glycolytic capacity. F)- Results for the MTT assay are presented as percentage of formazan crystals relative to the control. Because the goal was to evaluate cell oxidative status, MTT results were normalized for total cell number. CTR w/o LIF and DCA 5 mM showed a significant increase in the oxidative state. A total of 10 independent experiments were performed. * < 0.05; ** p< 0.01.

