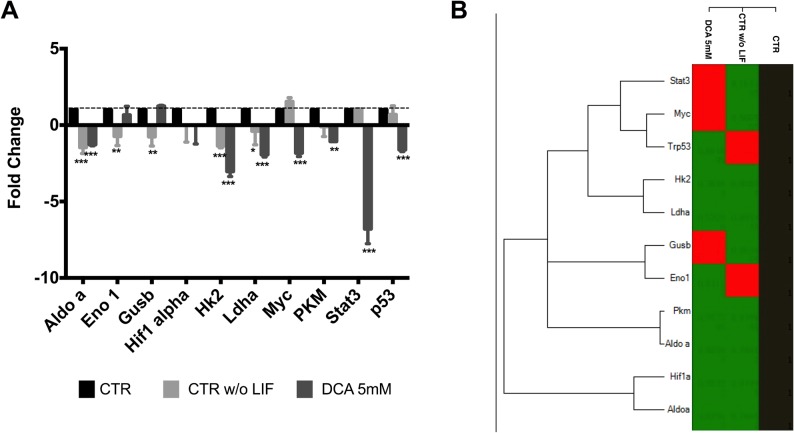
Fig 4. Metabolism-related gene expression in mESC following DCA treatment.
(A) Fold changes were calculated for the various genes using the -∆∆Ct method relative to the CTR condition. The values represent means ± SEM of four independent experiments. (B) Heat map of average gene expression represented as log10 of Ct values. An increase in gene expression is depicted in red, whereas a decrease in gene expression is represented by the green color. No differences in expression are depicted in black. Clustering was performed using the CFX manager software by Bio-Rad. * < 0.05; ** p< 0.01; ***p< 0.001.

