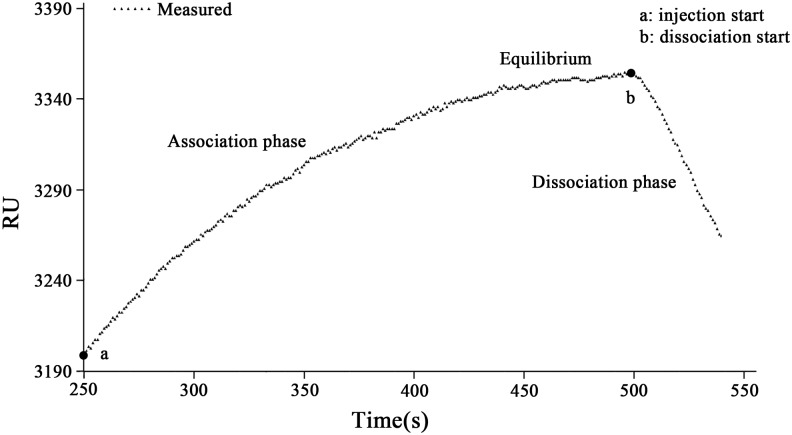
Fig 1. Sensorgram showing the association and dissociation processes of biomolecular interaction between HBsAg and HbsAb.
The data marked with a triangle is obtained in the average of more than three sets of measurement results in RU. This sensorgram is showing that the HBsAg was binding on the specific HBsAb (association phase) starting from the injection point a and reaches an equilibrium after approximately 251s. From the dissociation starting point b, the dissociation phase was formed sequentially. The microfludic cell of this SPR bioanalyzer was kept at a constant temperature of 37°C.

