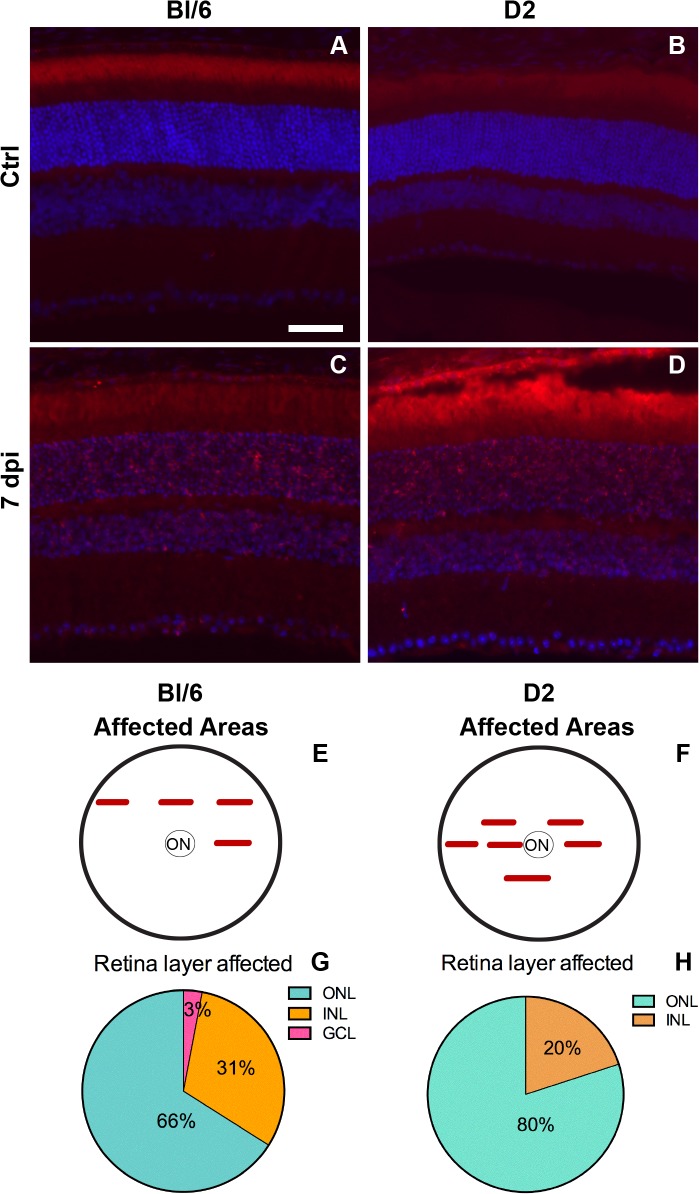
Fig 4. Cell death occurs in focal regions in both strains.
Epifluorescence micrographs of retinal cross-sections from Bl/6 and D2 control eyes (A,B) and 7dpi Bl/6 and D2 eyes (C,D). The retina is labeled with TUNEL (red) and DAPI (blue). The scale bar in (E) is 50μm and applies to all micrographs in the figure. (E-F) Schematics illustrating the locations of retinal cross-sections containing TUNEL-positive cells, in relation to the optic nerve (ON) in the Bl/6 (E) and the D2 (F). (G-H) Pie charts showing the percentage of TUNEL-positive cells in each retinal layer in the Bl/6 (G) and D2 (H).

