
Figure 5. Immunohistochemical Staining of MB Tissue Arrays for p-AKT and p-S6.
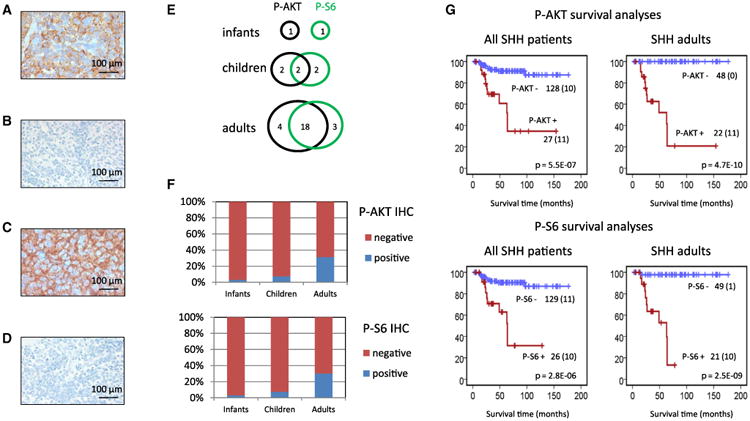
(A) Example of positive p-AKT MB.
(B) Example of negative p-AKT MB.
(C) Example of positive p-S6 MB.
(D) Example of negative p-S6 MB.
(E) Overlap in staining results between p-AKT and p-S6.
(F) Frequencies of p-AKT and p-S6 staining in infants, children, and adults.
(G) Survival analysis for p-AKT and p-S6 in all SHH patients and in adults only. Numbers on the y-axis indicate the fraction of surviving patients. Numbers on the x-axis indicate the follow-up time in months. The number of patients per group is indicated next to the graphs plus the number of events within that group (between brackets). For infants and children, the number of patients staining positive was too low to draw conclusions from separate survival analyses.