
Fig 2. Background fluorescence in transgenic fry of Ola-Tg(actin-DD-YFP)13.
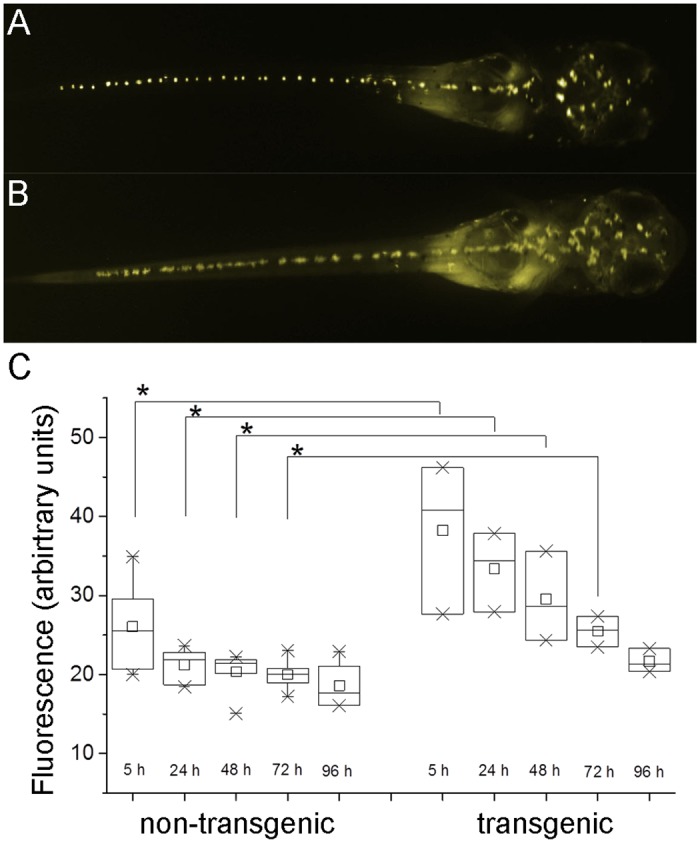
The fluorescence of hemizygous transgenic individuals treated with 0.1% ethanol and non-transgenic siblings was analyzed. (A) non-transgenic fry, (B) transgenic, non-induced fry. Monochrome images were colored for clarity, head to the right. (C) Box plot (25–75%), average (open square) and mean (line) of the fluorescence (arbitrary units) are shown. The values are normally distributed (Kolmogorow-Smirnov-test) in all samples and are significantly higher (asterisks, p≤0.05, ANOVA) for transgenics compared to non-transgenic fish within the first 72 hours of the experiment.