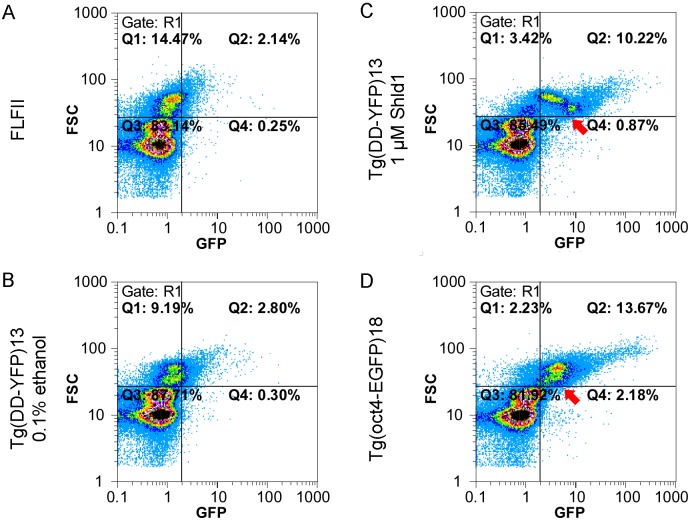
Fig 4. Induced fluorescence of testis cells analyzed by flow cytometry.
Primary testis cells of hemizygous Ola-Tg(DD-YFP)13 were analyzed for size (FSC), fluorescence (GFP) and DNA content (Gate R1; Hoechst staining, not shown). The quadrants Q1 and Q2 contain cells with a DNA content of 2C to 4C, i.e. somatic cells and germ cells prior to meiosis. The plots show the data of 129–154,000 single cells. (A) The fluorescence in a sample of a non-transgenic FLFII and was plotted against the cell size. (B) In the non-induced control virtually no additional fluorescence is observed in Q2 compared to FLFII. (C) Treatment with 1 μM Shield-1 causes a strong induction of fluorescence in the largest cells that comprise the stem cell fraction. Absolute fluorescence and number of cells in Q2 are increased. (D) For comparison, the GFP-positive stem cells in FLF-Tg(oct4-EGFP)18 are shown [17]. In this line, the fluorescence decreases during diffentiation (arrow). In contrast, a cell fraction of similar size has an elevated fluorescence after induction (arrow in C). These cells represent the mitotically active type B spermatogonia that actively transcribe the actb-driven DD-YFP but not the oct4-driven EGFP.

