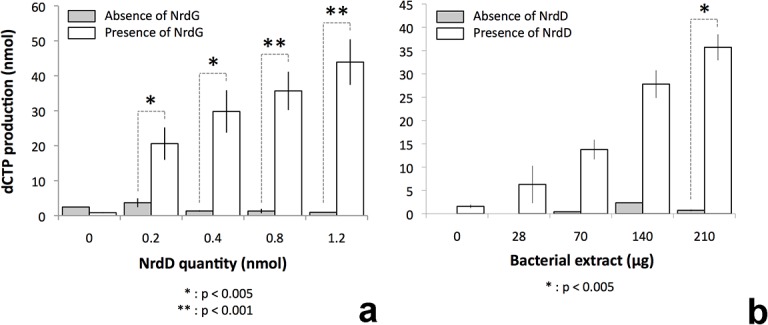
Fig 6. Activity assays for the T. maritima anaerobic RNR carried out in the presence of anaerobically prepared cell extracts.

a) White bars show activity in the presence of fixed amounts of cell extract and MBP-tagged tmNrdG and increasing amounts of tmNrdD. Grey bars show the corresponding activity in the absence of tmNrdG. b) activity in the presence of fixed amounts of tmNrdG and tmNrdD (0.4 nmol) and increasing amounts of T. maritima cell extract. White bars show the activity in the presence of tmNrdD and grey bars the corresponding activity in the absence of tmNrdD. The results are from 3–5 experiments, some performed with different protein preparations. All values are given as the mean +/- standard deviation. Statistical analysis was performed using the standard Student T-test.
