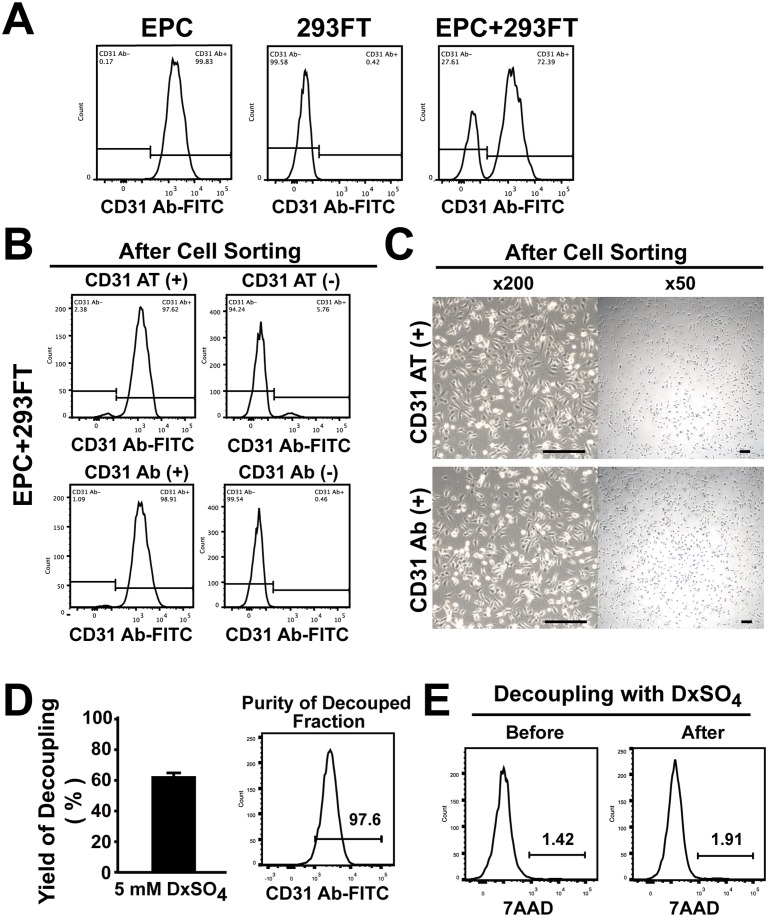
Fig 4. CD31 aptamers isolate EPCs from the mixture of EPCs and 293FT cells and EPCs are decoupled from CD31 aptamers.
(A) EPCs, 293FT cells, or the mixture of EPCs and 293FT cells were analyzed by flow cytometry after staining cells with FITC-labeled anti-human CD31 antibodies (n = 3). (B) The mixture of EPCs and 293FT cells was subjected to magnetic bead sorting using CD31 aptamers (AT-1, biotin-labeled) (upper panel) or CD31 antibodies (lower panel). (+) indicates the fraction with positive selection and (-) indicates the fraction with negative selection. Flow cytometry analysis of each fraction with CD31 antibodies (FITC-labeled) after isolation is shown (n = 3). (C) Bright field images of cultured cells in (+) fraction after magnetic bead isolation of the mixture of EPCs and 293FT cells with CD31 aptamers (upper panel) or CD31 antibodies (lower panel) are shown. Scale bar = 200 μm (n = 3). (D) Decoupling of EPCs from CD31 aptamer-EPC complexes by treatment with DxSO4. EPCs were decoupled from the CD31 aptamer-EPC complexes and recovery yield was calculated by comparing cell numbers before and after decoupling with DxSO4 (left panel) (n = 4). Flow cytometry analysis of decoupled cells with CD31 antibody is shown in the right panel. (E) Viability of EPCs before and after decoupling with DxSO4 is shown by flow cytometry analysis (n = 5).

