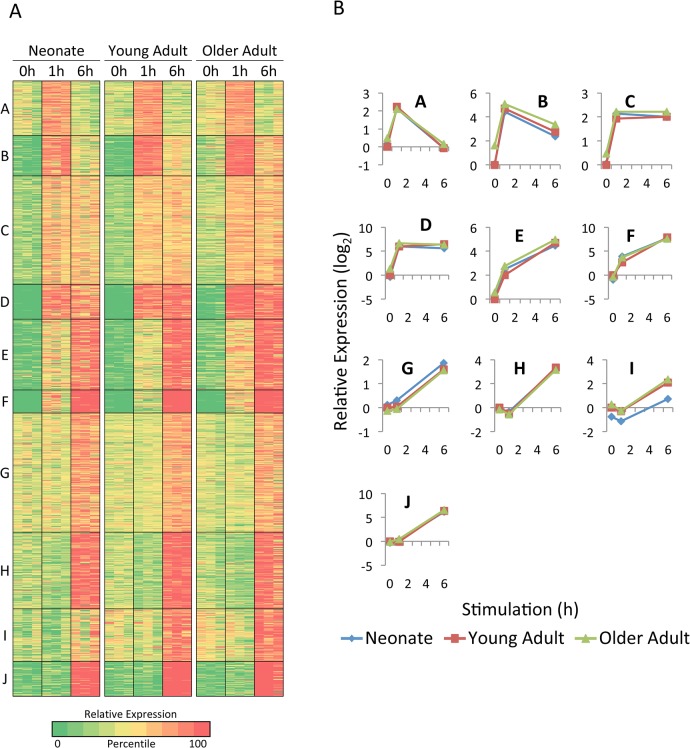
Fig 3. Analysis of LPS-induced genes in monocytes by K-means cluster analysis.
(A) The 1147 genes that exceeded 200 bp in length, exhibited an RPKM of at least 4 in one sample, and were induced by LPS by at least 5-fold in the same sample were divided into 10 clusters by k-means cluster analysis, which considers similarities in transcript levels for each gene across all 27 samples (3 age groups, 3 samples for each age group, and 3 time points for each sample). The three independent samples are shown in parallel for each age group. Colors indicate the percentile of the relative expression level (based on the log-transformed mean-centered RPKM for each gene), as indicated at the bottom. (B) The average relative transcript levels for genes within each cluster are shown for each age group (neonates, blue diamonds; young adults, red squares; older adults, green triangles).

