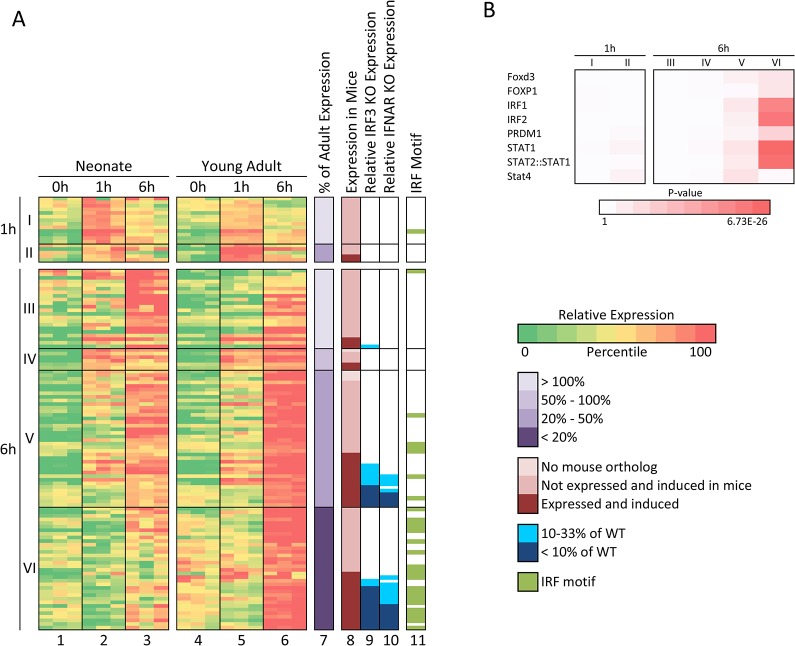
Fig 5. Genes that exhibit the greatest expression deficit in LPS-stimulated cord blood monocytes in comparison to adult monocytes are regulated by IRF3 and/or Type I IFNs.
(A) LPS-induced genes exhibiting statistically significant differential expression in neonates and adults (n = 118) were grouped according to the time point at which their maximum transcript levels were observed (1 or 6 hrs). They were then grouped according to their relative maximum transcript levels in cord blood (neonates) versus young adults. Induced genes with a higher maximum transcript level in neonates than young adults (with statistically significant differential expression) are included in classes I (1-hr peak) and III (6-hr peak) (column 7). Genes exhibiting a maximum transcript level in neonates that was 50–100% of the young adult transcript level (but with statistically significant differential expression) are included in class IV (no genes with peak transcript levels at 1-hr fit this criterion). Genes exhibiting a maximum transcript level in neonates that was 20–50% of the young adult transcript level are in classes II (1-hr) and V (6-hr). Genes with a maximum transcript level in neonates below 20% of the young adult transcript level are in class VI. The differential expression of six of these genes was confirmed by quantitative RT-PCR (data not shown). Columns 1–6 show the relative transcript levels (based on the log-transformed mean-centered RPKM) for these 118 classified genes in all samples and all time points from both neonates and young adults. Column 8 indicates genes that lack obvious mouse orthologs (lightest pink), genes that contain mouse orthologs that are either not expressed or not induced in mouse bone marrow-derived macrophages (dark pink), and genes containing mouse orthologs that are both expressed and induced by LPS (red). Columns 9 and 10 show relative expression of the mouse ortholog of the human gene in Lipid A-stimulated macrophages from IRF3-/- and IFNAR-/- mice, respectively (see blue scale at right). Note that these columns are only relevant for genes shown in red in Column 8. Column 11 indicates genes with promoters that contain an IRF1 transcription factor binding motif between -450 and +50 bps relative to the transcription start site. (B) Enrichment of transcription factor binding sites determined using the Pscan program is shown for each gene class from panel A. Color intensity is proportional to the negative log(p-value).

