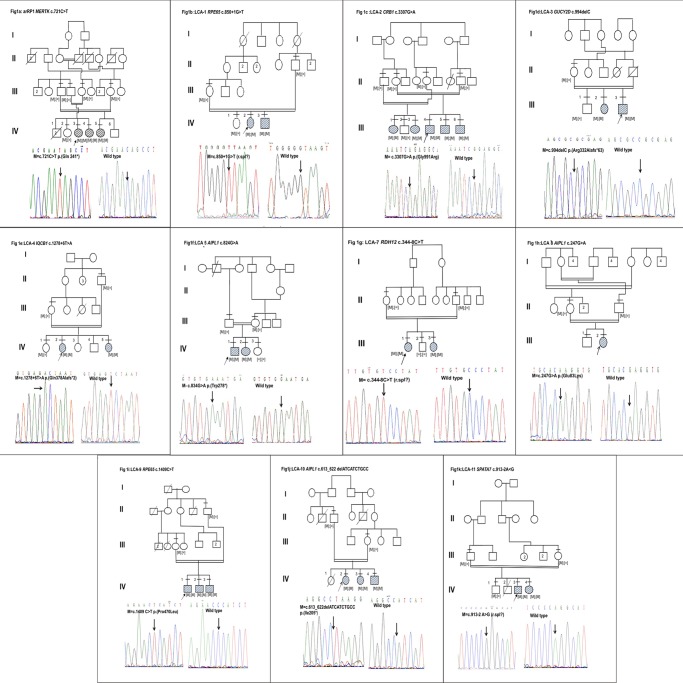
Fig 1. Segregation analysis.
1a:arRP1 MERTK c.721C>T, 1b:LCA-1 RPE65 c.850+1G>T, 1c: LCA-2 CRB1 c.3307G>A, 1d:LCA-3 GUCY2D c.994delC, 1e:LCA-4 IQCB1 c.1278+6T>A, 1f:LCA-5 AIPL1 c.824G>A, 1g: LCA-7 RDH12 c.344-8C>T, 1h:LCA-8 AIPL1 c.247G>A, 1i:LCA-9 RPE65 c.1409C>T, 1j:LCA-10 AIPL1 c.613_622 delATCATCTGCC, 1k:LCA-11 SPATA7 c.913-2A>G. The arrow indicates the index case. The filled in circles and squares are affected females and males respectively. [M];[M]–affected with homozygous mutation, [M]; [=] –carries for any given mutation and [=]; [=] –wild type. Lines above the individual indicate availability of genotype.

