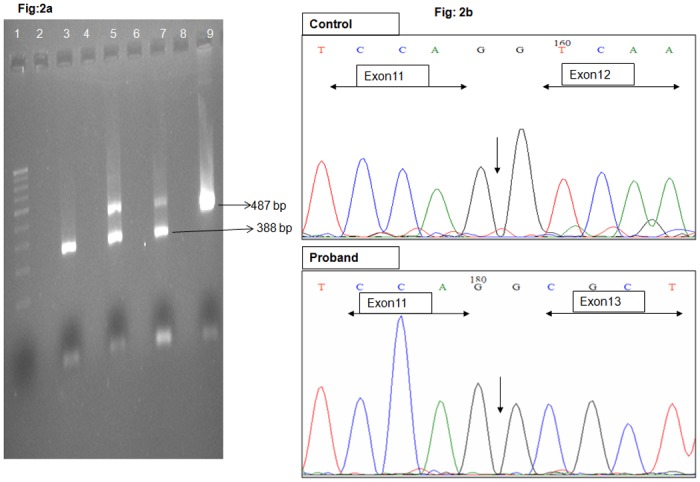
Fig 2. 2% Agarose gel electrophoresis showing cDNA amplification of exon 11–13 of IQCB1.

Lane 1-100bp ladder, Lane 3- Affected index case, Lane 5 & 7—Carrier parents, Lane 9—Control, Lane 2, 4, 6, 8—empty wells Fig 2b Eletrophoretogram trace showing the amplified cDNA of control and proband. In proband exon 11 is followed by exon 13 and exon 12 is completely deleted, whereas in control, exon 11, 12 and 13 is continuous. The end of exon 11 is marked in both the phoretograms.
