
Fig 2. Comparison of bactericidal activity of photolysis of H2O2 with or without ultrasound irradiation.
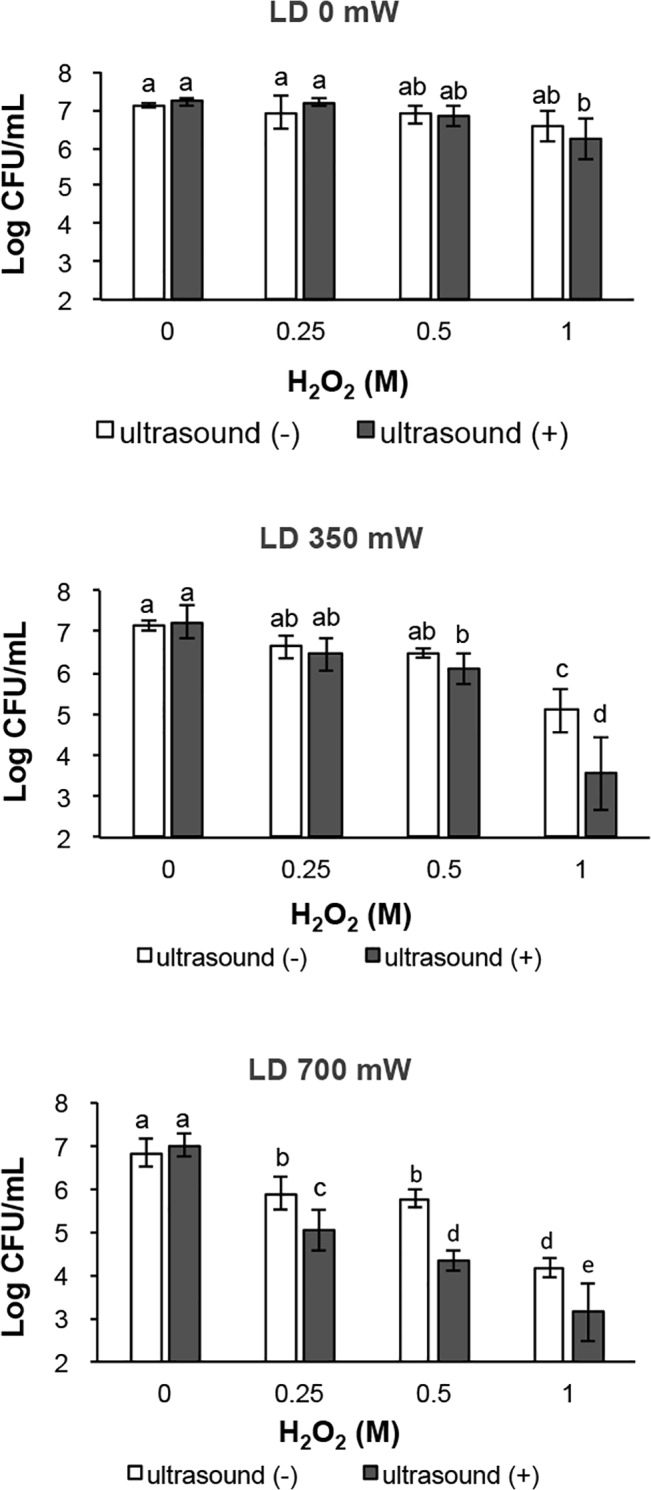
Each value represents the mean of six independent assays with standard deviation. Statistical analysis was conducted at each LD output power. Significant difference (p<0.01) between the two groups is demonstrated by the different alphabetical letter (i.e., bars with the same letter are not significantly different).