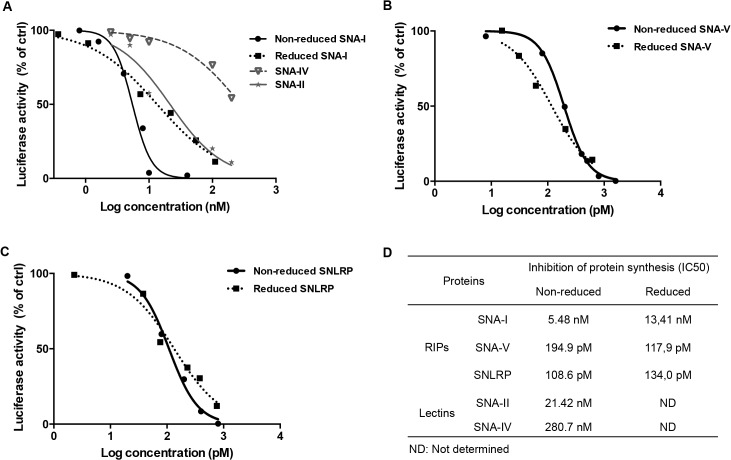
Fig 1. Effect of the S. nigra RIPs and lectins on protein synthesis in a cell-free translation assay.
(A) Dose response curves of luciferase synthesis in treatments with SNA-I (non-reduced and reduced) and lectins (SNA-II, SNA-IV). (B and C) Dose response curves of luciferase synthesis in the treatments with non-reduced and reduced RIP for SNA-V and SNLRP, respectively. (D) IC50 values for the RIPs and lectins.

