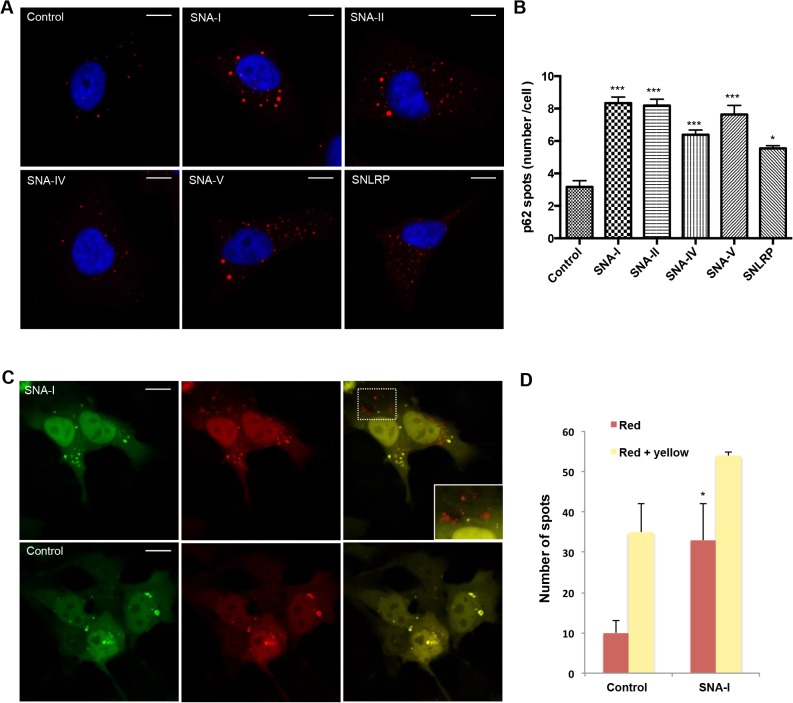
Fig 5. S. nigra proteins induce autophagy.
(A) Confocal images of HeLa cells treated with S. nigra proteins, immuno-stained for p62 (red) and counterstained with DAPI (blue). (B) Quantification of p62 puncta numbers/cell (n>600 cells). Asterisks denote values significantly different from the cells incubated in the control (medium containing 1 x PBS) (*: p < 0,05; **: p< 0,01; ***: p < 0,001). (C) representative images of HeLa cells transfected with a tandem fluorescent mRFP-GFP-LC3 treated with 1x PBS (control) or SNA-I, (D) Quantification of yellow (autophagosomes) and red (autophagolysosomes) puncta reveals increased autophagy (total number of spots) as well as autophagic flux (red spots) in SNA-I treated cells. The asterisk indicates a significant difference compared to the control with P-value < 0.05. Scale bars in panels A and C represent 10 μm and 15 μm, respectively.

