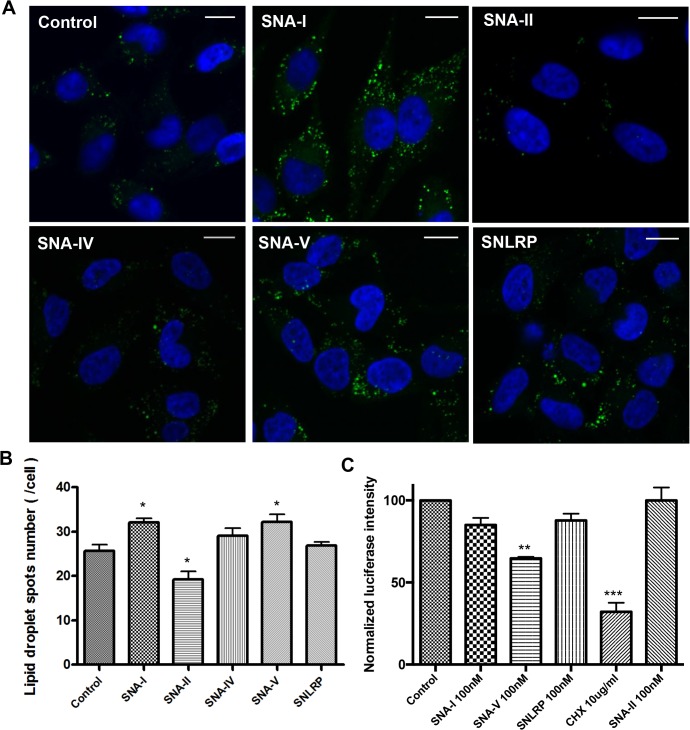
Fig 6. In cellula protein translation inhibition activity of S. nigra RIPs (A) Merged confocal images of HeLa cells stained with DAPI (blue) and BODIPY (green).
Scale bars represent 15 μm. (B) Average numbers of LDs/cell (n>400) (C) Luciferase activity measured in HG1-luc2-IRES-tCD cells incubated with S. nigra RIPs/lectins and controls. The treatment with 1 x PBS was selected as the negative control, and cycloheximide was used as a positive control. The luminescent signal was normalized by the fluorescence signal from the Presto blue assay to correct for variations in cell density. Asterisks denote values significantly different from the cells incubated with control (1 x PBS) (*: p < 0,05; **: p< 0,01; ***: p < 0,001).

