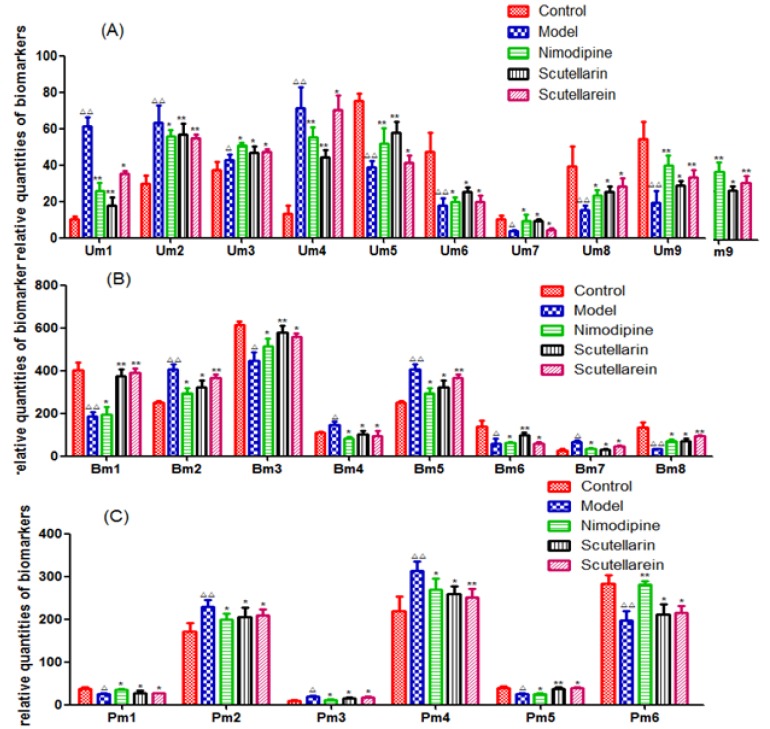
Fig 4. Changes in the relative quantities of target metabolites identified in different groups.
Um, urine metabolites; Bm, brain metabolites; and Pm, plasma metabolites. Statistical analysis compared with the sham-operated group, △ p <0.05, △△ p<0.01, and compared with the model group, *p<0.05, **p<0.01; (A) 9 endogenous metabolites in the urine; (B) 8 endogenous metabolites in the brain tissue; and (C) 6 endogenous metabolites in the plasma.

