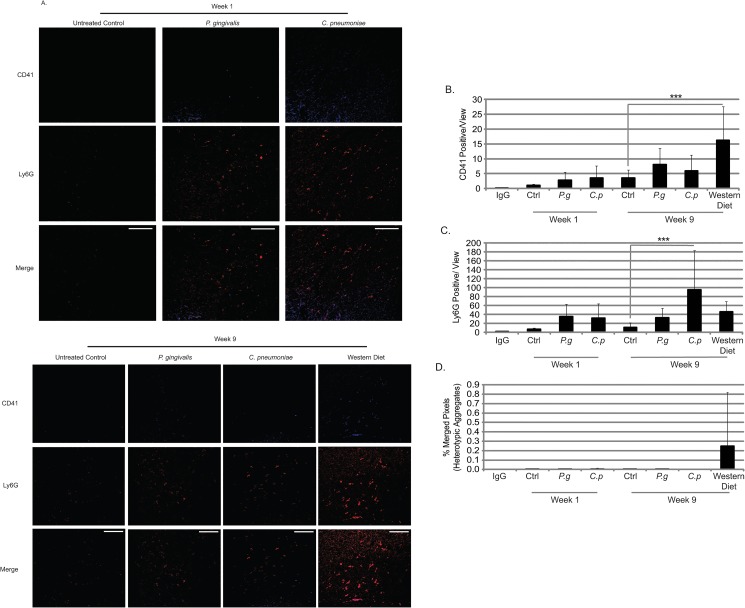
Fig 7. Platelet and neutrophil content in spleens in ApoE-/- mice with infection and diet.
(A) Spleen sections from ApoE-/- mice at week 1 and week 9 were stained for CD41 (platelet marker; Alexa Fluor 405) and Ly6G (neutrophils; Texas Red) and visualized by confocal microscopy at 63X. The amount of CD41 staining (area; B), Ly6G staining (area; C), and the overlap of each signal (% pixels with overlapping signal); (D) were quantified. Data is normally distributed and analyzed using an ANOVA. n = 3 for each condition; ***p<0.001 compared to Untreated Control. Scale Bar in merged images = 50.0 μm.

