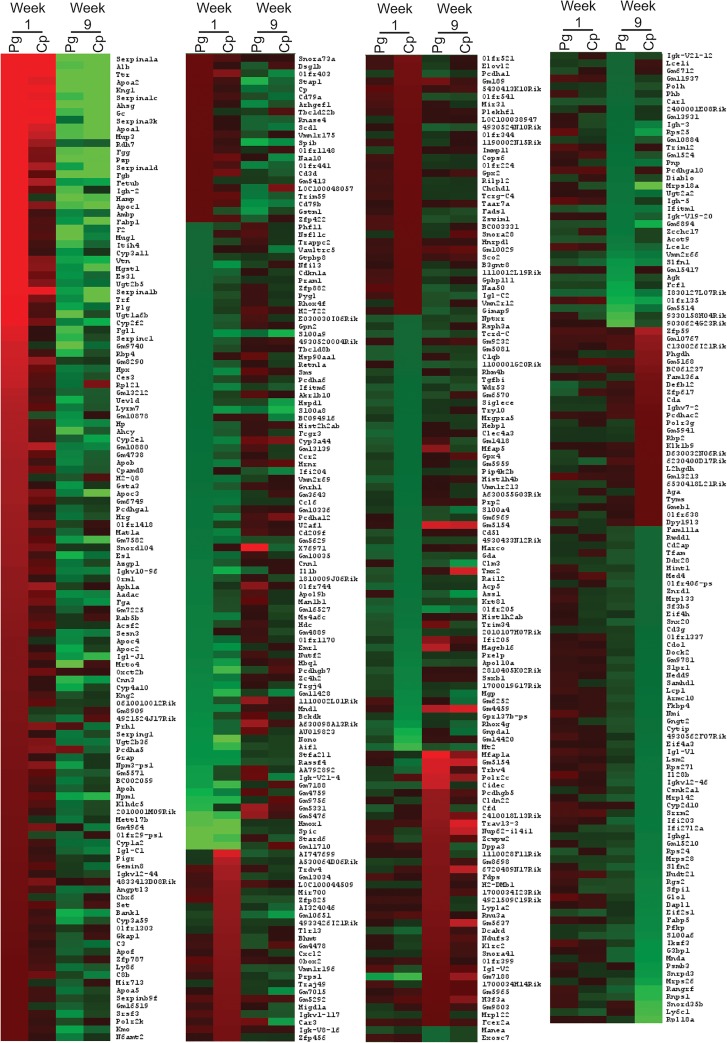
Fig 8. Comparison of genes affected by both bacterial infections at week 1 and week 9.
Heatmap shows the transcripts identified through microarray as upregulated or downregulated 2-fold or more with either P. gingivalis (Pg) or C. pneumoniae (Cp) infection compared to Untreated Control in the ApoE-/- mice at week 1 and 9. Each condition represents RNA from 3 mice pooled.

