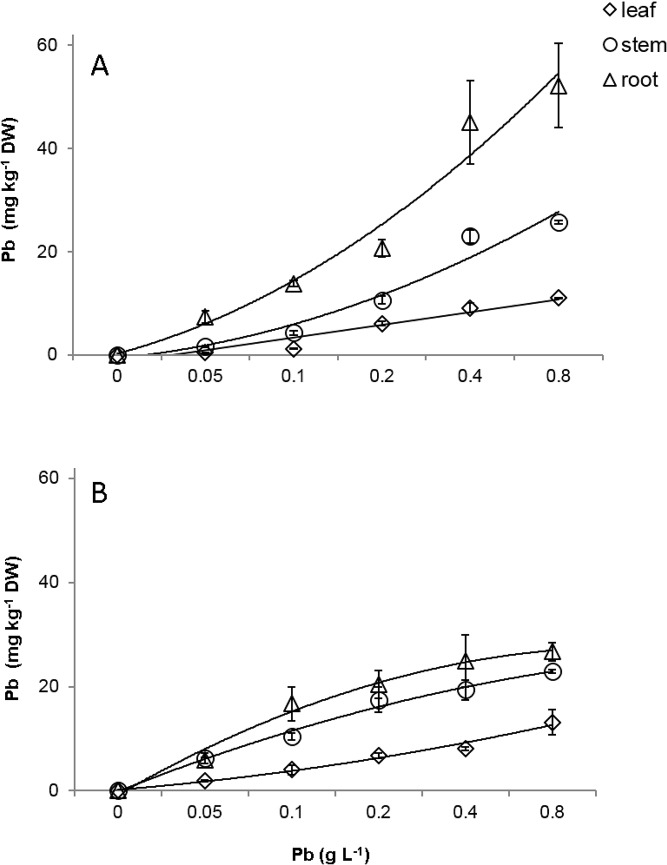
Fig 8. Accumulation of Pb in roots (triangle), stem (circle) and leaves (rhombus) of two progenies of T. cacao submitted to increasing of Pb doses.
CCN-10 x SCA-6 (A) and Catongo (B). Mean values of nine replicates (± SE). The equations of the regression curves were: CCN-10 x SCA-6: ŷ = - 3.99 + 2.46*x (R² = 0.92) for leaf, ŷ = - 9.02 + 5.68*x, (R² = 0.92) for stem, ŷ = -17.58 + 11.74*x (R² = 0.87) for root. Catongo: y = - 3,047 + 2.49*x (R² = 0.96) for leaf, ŷ = -10.43 + 10.43*x– 0.88 x2 (R² = 0.94) for stem, ŷ = - 0.92 + 5.68 ln*(x) (R² = 0.93) for root.

