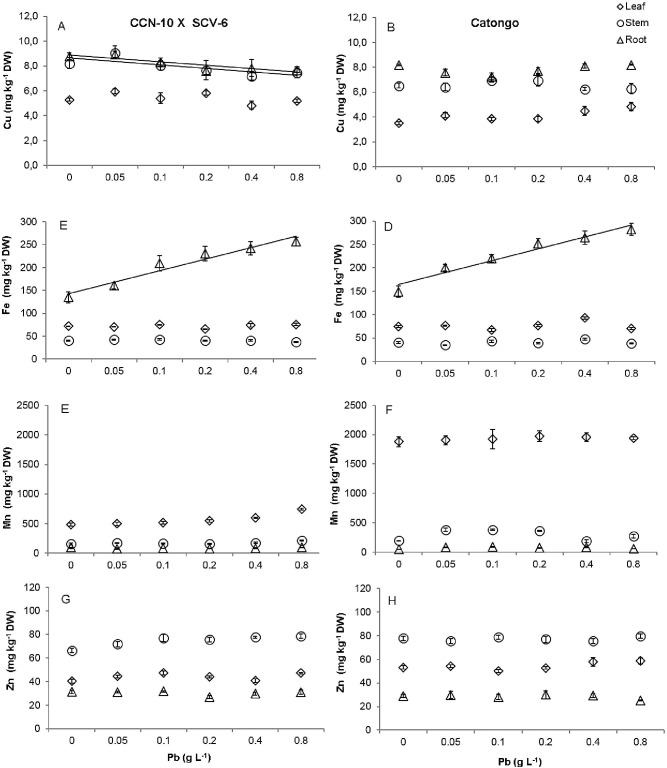
Fig 10. Accumulation of mineral micronutrients (Cu, Fe, Mn and Zn) in roots (triangle), stem (circle) and leaves (rhombus) of two progenies of T. cacao exposed to increasing Pb doses.
CCN-10 x SCA-6 (A,C,E e G) and Catongo (B,D,F e H). Mean values of nine replicates (± SE). The absence of error bars indicates that the size of the error does not exceed the size of the symbol. The equations of regression curves were: Cu—CCN-10 x SCA-6: ŷ = 5.43 for leaf, ŷ = 8.65–0.278x (R2 = 0.51) for stem, ŷ = 8.88–0.2753*x (R2 = 0.74) for root. Catongo: ŷ = 4.11 for leaf, ŷ = 6.57 for stem, ŷ = 3.03 for root. Fe—CCN-10 x SCA-6: ŷ = 72.07 for leaf, ŷ = 40.86 for stem, ŷ = 118.10 + 24.97*x (R2 = 0.94) for root. Catongo: ŷ = 76.21 for leaf, ŷ = 40.36 for stem, ŷ = 138.90 + 25.49*x (R2 = 0.93) for root. Mn—CCN-10 x SCA-6: ŷ = 563.1 for leaf, ŷ = 173.5 for stem, ŷ = 84.1 for root. Catongo: ŷ = 1928.84 for leaf, ŷ = 295.4 for stem, ŷ = 72.52 for root. Zn—CCN-10 x SCA-6: ŷ = 44.5 for leaf, ŷ = 74.54 for stem, ŷ = 30.35 for root. Catongo: ŷ = 54.51 for leaf, ŷ = 77.43 for stem, ŷ = 28.51 for root.

