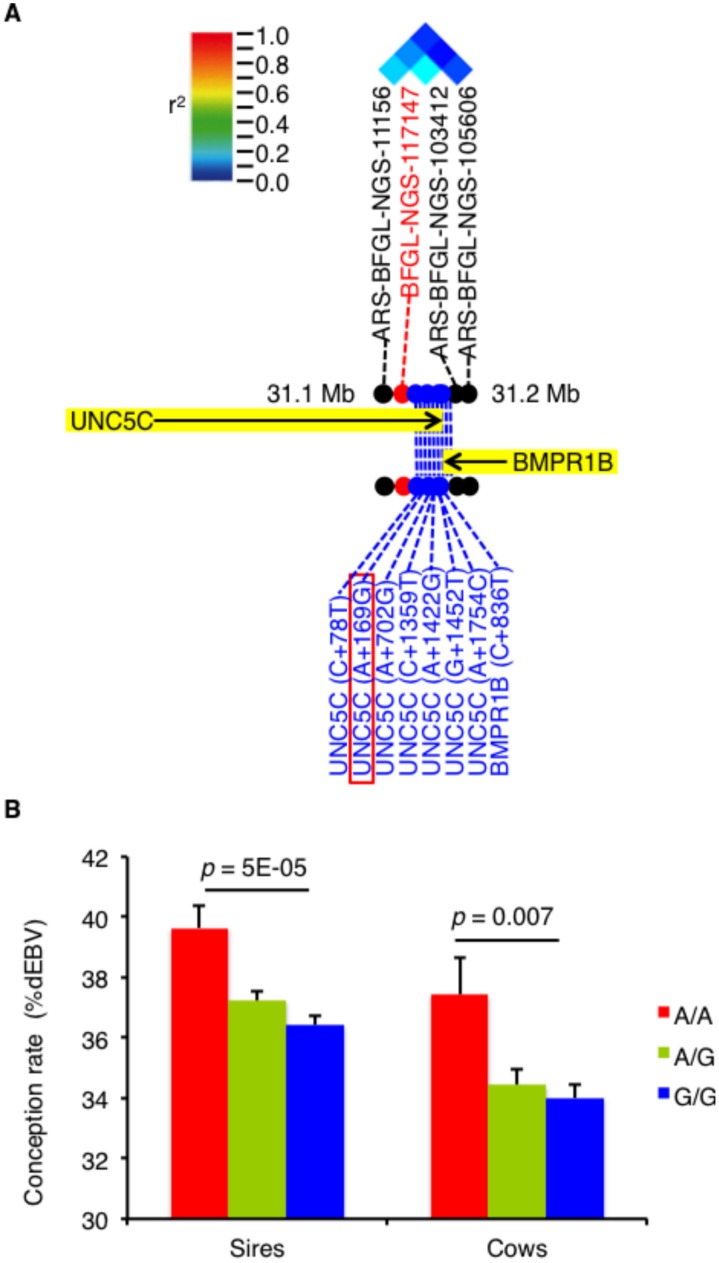
Fig 2. The UNC5C 3’UTR SNP is associated with conception rate.
A. A pairwise linkage disequilibrium diagram showing a schematic representation of the genes (black arrow) located in the associated region on chromosome 6. The red, black, and blue dots represent the genome-wide significant SNPs, the original SNPs, and the newly developed SNPs, respectively. B. The average conception rate ± SE values for the sires and cows in terms of dEBV. The p-value was calculated using Student’s t-test.

