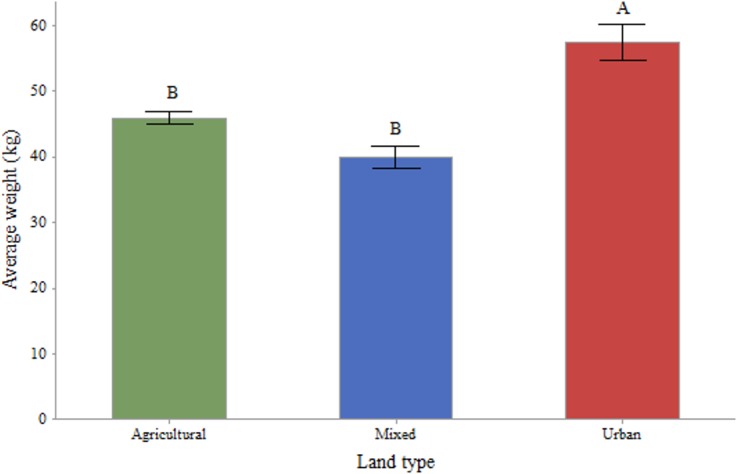
Fig 8. Average hive weights, in kg, by landscape type for a 1km radius around the hives.

Agricultural (n = 49; mean = 45.94): More than 50% of the surrounding 1km landscape composed of agricultural areas; Urban (n = 12; mean = 57.50): More than 50% of the surrounding 1km landscape composed of urban areas; Mixed (n = 10; mean = 39.90): A combination of landscape types surrounding the apiary with no single habitat type representing more than 50% of the total landscape. Means that do not share a letter are statistically significant.
