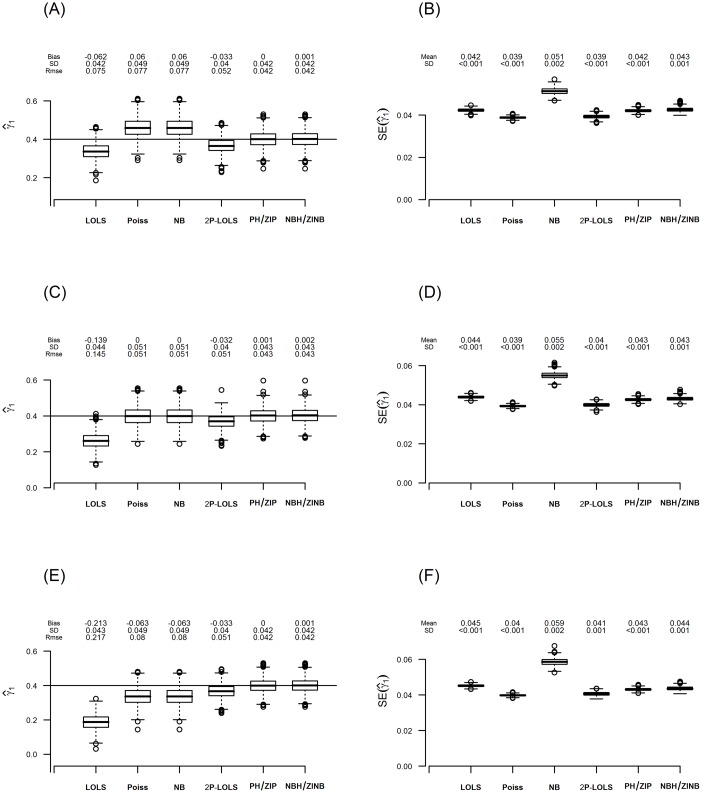
Fig 5. The estimate of γ 1 and its standard error for data simulated under ZIP with ϕ c = 20%.
The figure displays box-plots of estimates and their standard errors for γ 1 from 1000 replications in (A) and (B); (C) and (D); and (E) and (F) for the consonant (ϕ t = ϕ c − 5%), neutral (ϕ t = ϕ c) and dissonant (ϕ t = ϕ c + 5%) effect case, respectively. For each box of the boxplots, the center line represents the median, the bottom line represents the 25th percentiles and the top line represents the 75th percentiles. The whiskers of the boxplots show 1.5 interquartile range (IQR) below the 25th percentiles and 1.5 IQR above the 75th percentiles, and outliers are represented by small circles. The horizontal line in (A), (C) and (E) represents the true value of γ 1 (= 0.4) and the bias, standard deviation (SD), and root mean square error (RMSE) of the estimations of γ 1 are shown above its box-plot for each method. The mean and standard deviation (SD) of the standard error (SE) estimations are shown above the box-plot for each method in panels (B), (D) and (F).

