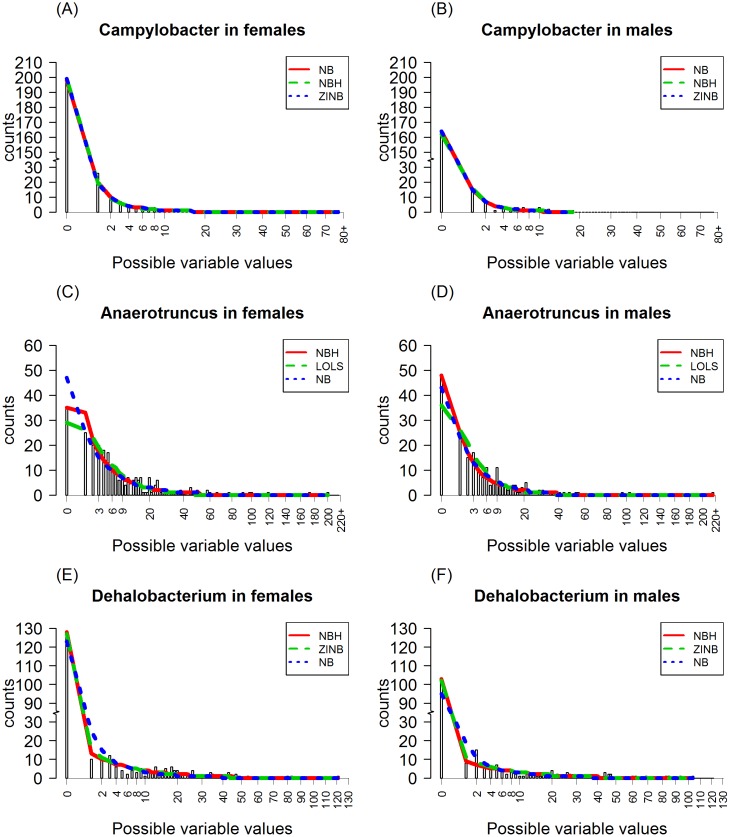
Fig 11. The comparison plots of the observed and expected counts of bacteria for Campylobacter, Anaerotruncus and Dehalobacterium for females and males using the best three models judging by AIC criterion.
The X axis is the possible values of the OTUs, the bars are the observed counts, the red line connects the expected counts produced by the model with smallest AIC values, the green line connects the expected counts produced by the model with the second smallest AIC values and the blue line connects the expected counts produced by the model with the third smallest AIC values. The first, second and third row of the plots are for bacteria Campylobacter, Anaerotruncus, and Dehalobacterium, respectively.

