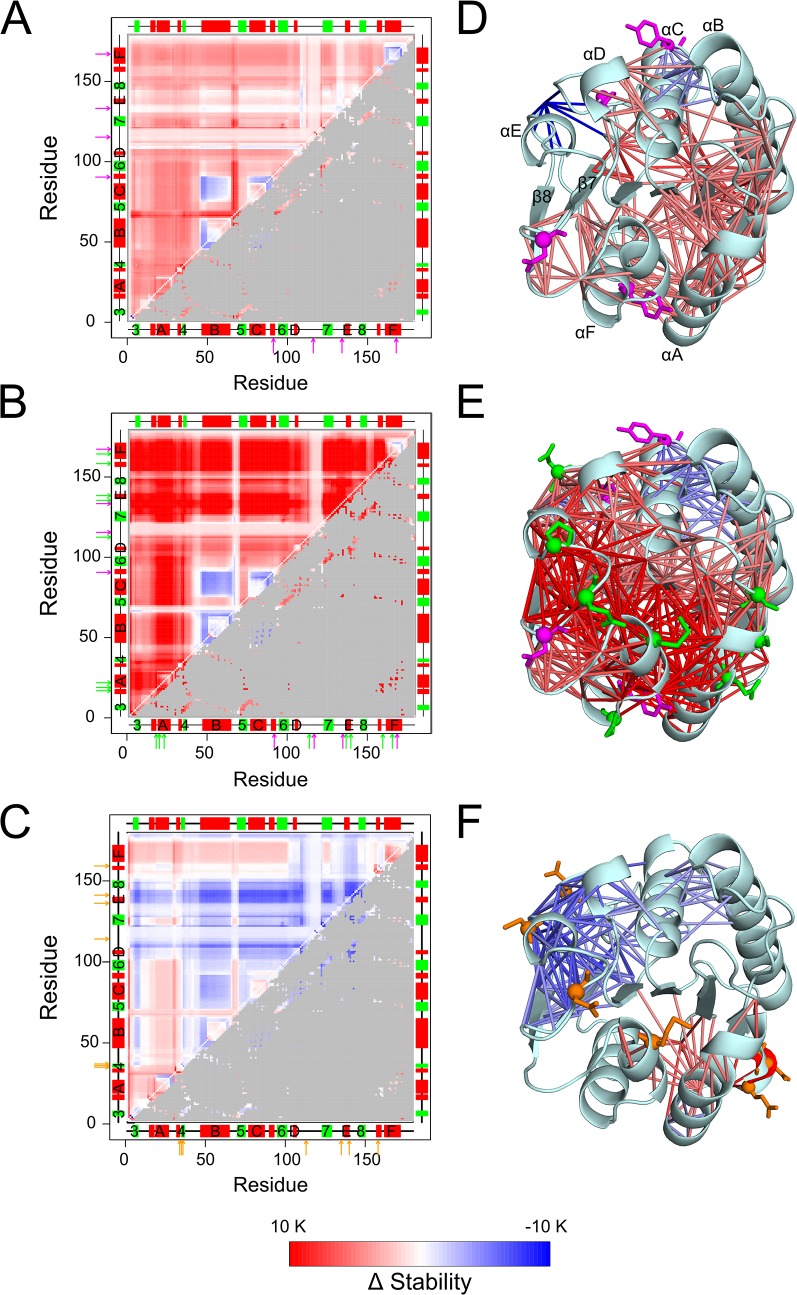
Fig 6. Differences in the stability of rigid contacts between wild type and mutants of BsLipA.
Maps depict differences between stability maps of the respective mutants and an average stability map of the six wild type structures (see the main text for explanation) for A: mutant 1-14F5, B: mutant 6B, and C: mutant X. A red (blue) color indicates that a rigid contact in the mutant is more (less) stable than in the wild type (see color scale at the bottom). The upper triangles show differences in the stability values for all residue pairs; the lower triangles show differences in the stability values only for residue pairs that are within 5 Å of each other, with values for all other residue pairs colored gray. Secondary structure elements as computed by the DSSP program [88, 89] are indicated on both abscissa and ordinate and are labeled: α-helix (red rectangle), β-strands (green rectangle), loop (black line). Arrows represent the mutation positions with respect to the wild type sequence: Common mutations in 1-14F5 (A) and 6B (B) are shown in magenta, unique mutations in 6B (B) are shown in green, and mutations in X (C) are shown in orange. The differences in the stability of rigid contacts for residue neighbors is also displayed on the structures of the mutants by sticks connecting Cα atoms of residue pairs colored according to the color scale of the maps for D: 1-14F5, E: 6B, and F: X. Only those contacts that are stabilized by ≥ 4 K or destabilized by ≥ 3 K are shown for clarity; for the same reason, contacts between two residues of the same secondary structure element are not shown. Mutated residues are shown as sticks and a sphere at their Cα atoms (D, E, and F) in the same color used for arrows (A, B, and C).

