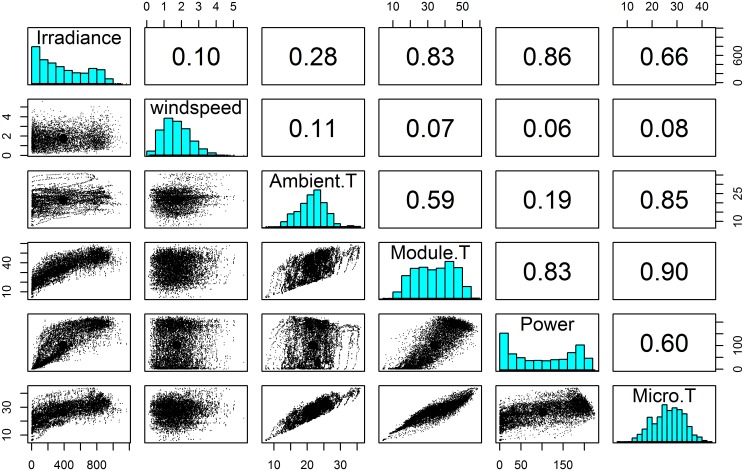
Fig 2. Pairwise scatter plot matrix, histogram and correlation coefficients of all related variables for the microinverters connected with different brands of PV module.
Pairwise scatter plots are in lower triangle boxes, histograms are in the diagonal boxes, and upper triangle boxes give the correlation coefficients between variables. Brand, Ambient. T, Wind speed, Module. T, Power and Micro. T denote PV module brand, ambient temperature, 5 point moving average wind speed, PV module temperature, AC power output and microinverter temperature respectively.

