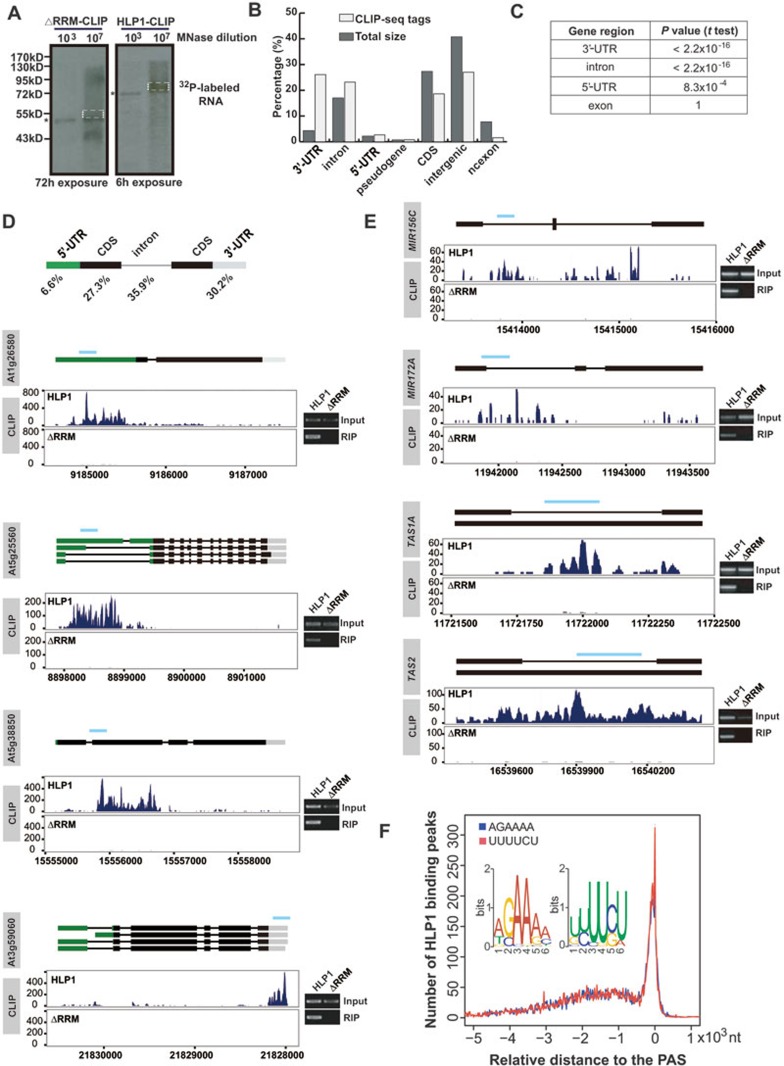
Figure 2.
HLP1 preferentially binds to the A- and U-rich elements in the 3′-UTR and introns of targeted transcripts. (A) Immunoprecipitation of the HLP1-RNA complex. Positions of the 32P-labeled HLP1ΔRRM-RNA complex (left panel) and the HLP1-RNA complex (right panel) after MNase over-digestion (*) are indicated. The protein-RNA complex in dashed box was purified and used to prepare the library for high-throughput sequencing. (B) Percentages of 5′-UTR, 3′-UTR, intron, CDS, pseudogene, ncexon and intergenic region in Arabidopsis genome (dark grey) and HLP1 CLIP-seq tags (light grey). (C) HLP1 CLIP tags are significantly enriched in 3′-UTR and intron. (D) Distribution and percentage of HLP1 binding sites in genes. Binding sites are shown as wiggle plots on the left (blue for the HLP1 library and dark grey for the ΔRRM library). CDS regions are boxed in black. The 5′-UTR and 3′-UTR are boxed in green and grey, respectively. Introns are indicated as lines. Blue line above gene structure indicates RIP-RT-PCR amplified region. The x axis indicates genome location in chromosome. The y axis indicates normalized HITS-CLIP/CLIP-seq abundance. HITS-CLIP/CLIP-seq tag counts were normalized to tag per 10 million (TP10M) to adjust for differences of two HITS-CLIP/CLIP-seq libraries in sequencing depth. Right panels show validation of binding by RIP-RT-PCR. (E) HLP1 binds to transcripts of small RNA genes. Binding sites are shown as wiggle plots on the left (blue for the HLP1 library and grey for the ΔRRM library). CDS regions are boxed in black. Introns are indicated as lines. Blue line above gene structure indicates RIP-RT-PCR amplified region. The x axis indicates genome site in chromosome. The y axis indicates normalized HITS-CLIP/CLIP-seq abundance. HITS-CLIP/CLIP-seq tag counts were normalized to tag per 10 million (TP10M) to adjust for differences of two HITS-CLIP/CLIP-seq libraries in sequencing depth. Right panels show validation of binding by RIP-RT-PCR. (F) Distribution of the two overrepresented binding motifs (insert) relative to the poly(A) site (PAS, indicated as 0) are indicated by blue and red curves, respectively.

