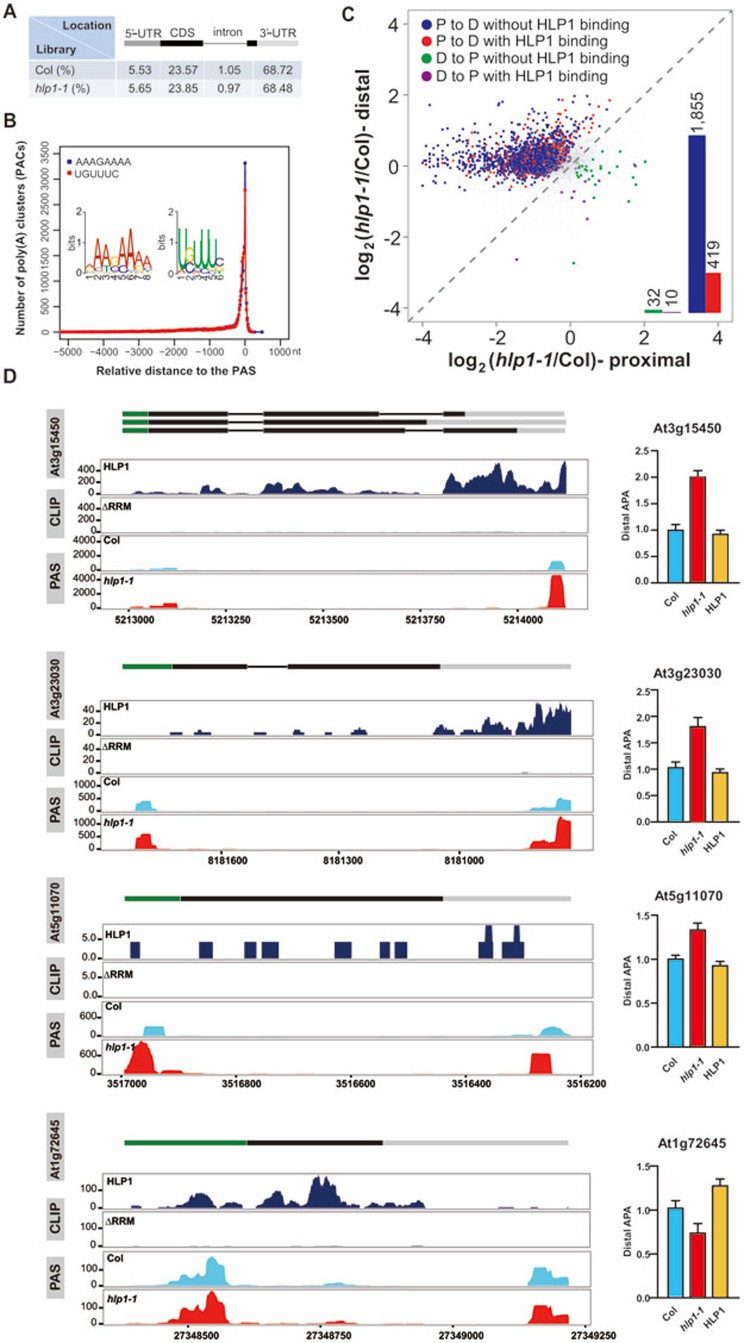
Figure 4.
HLP1 regulates global APA. (A) Distribution of poly(A) clusters. (B) Distribution of A-rich and U-rich PAC motifs relative to the poly(A) site (PAS) are indicated by blue and red curves, respectively. (C) Scatter plots show poly(A) site shifts in hlp1-1 mutant. The x axis and y axis show the ratio of PAC counts on a log2 scale between hlp1-1 and Col at proximal and distal poly(A) sites, respectively. Genes with significant proximal-to-distal poly(A) site shifts (P-to-D) are indicated by blue dots and red dots; genes with significant distal-to-proximal shifts (D-to-P) are colored in green and purple. Red and purple dots represent APA shifts with HLP1 binding. Bar graphs indicate the number of these dots. Grey dots represent genes without significant changes in APA. The poly(A) site shifts were evaluated using Fisher's exact test (P < 0.02). (D) Case studies of transcripts with APA shift. Wiggle plots on the left panels show P-to-D shift at At3g15450, At3g23030, At5g11070 and D-to-P shift at At1g72645. CDS regions are boxed in black. The 5′-UTR and 3′-UTR are boxed in green and grey, respectively. Introns are indicated as lines. The x axis indicates genome site in chromosome. The y axis indicates normalized HITS-CLIP/CLIP-seq or PAS-seq abundance. HITS-CLIP/CLIP-seq or PAS-seq tag counts were normalized to tag per 10 million (TP10M) to adjust for differences of two libraries (wild-type and mutant) in sequencing depth. Right panels show RT-qPCR assessments of the shift.

