Figure 5.
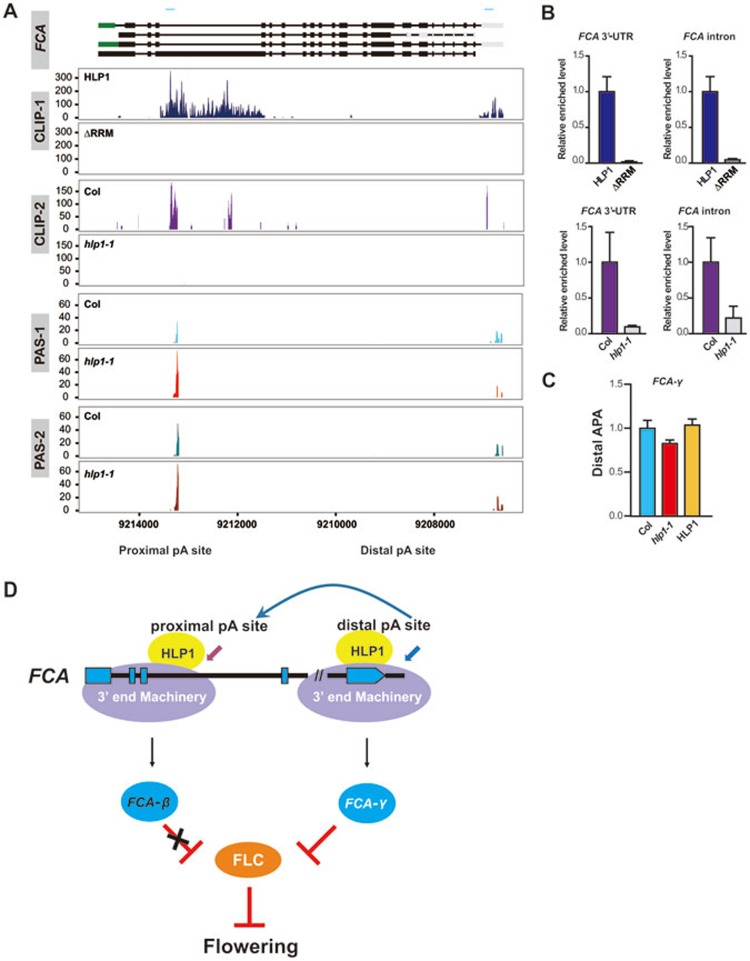
HLP1 directs poly(A) site choice at the FCA transcripts. (A) The genomic structures of FCA transcripts are shown in the top panel. CDS regions are boxed in black. The 5′-UTR and 3′-UTR are boxed in green and grey, respectively. Introns are indicated as lines. Blue line above gene structure indicates RIP-qPCR amplified region. Wiggle plots of two HITS-CLIP/CLIP-seq (CLIP-1 and CLIP-2) and two PAS-seq (PAS-1 and PAS-2) replicates are shown below the gene structure. HLP1 binding peaks in the third intron and 3′-UTR of FCA transcripts are indicated by blue and purple wiggle plots. The x axis indicates genome site in chromosome. The y axis indicates normalized HITS-CLIP/CLIP-seq or PAS-seq abundance. HITS-CLIP/CLIP-seq or PAS-seq tag counts were normalized to tag per 10 million (TP10M) to adjust for differences of two libraries (wild-type and mutant) in sequencing depth. PAS-Seq analyses show decreased PAC numbers at the distal 3′-UTR poly(A) site in hlp1-1 mutant (red plots in PAS-1 and brown plots in PAS-2) compared with Col (light blue plots in PAS-1 and green plots in PAS-2). (B) RIP-qPCR validation of HLP1 binding to the third intron and 3′-UTR of FCA transcripts. (C) Quantitative PCR results show decreased APA at the distal poly(A) site of FCA in hlp1-1 mutant. (D) Working model for HLP1-directed APA of FCA in the regulation of flowering.

