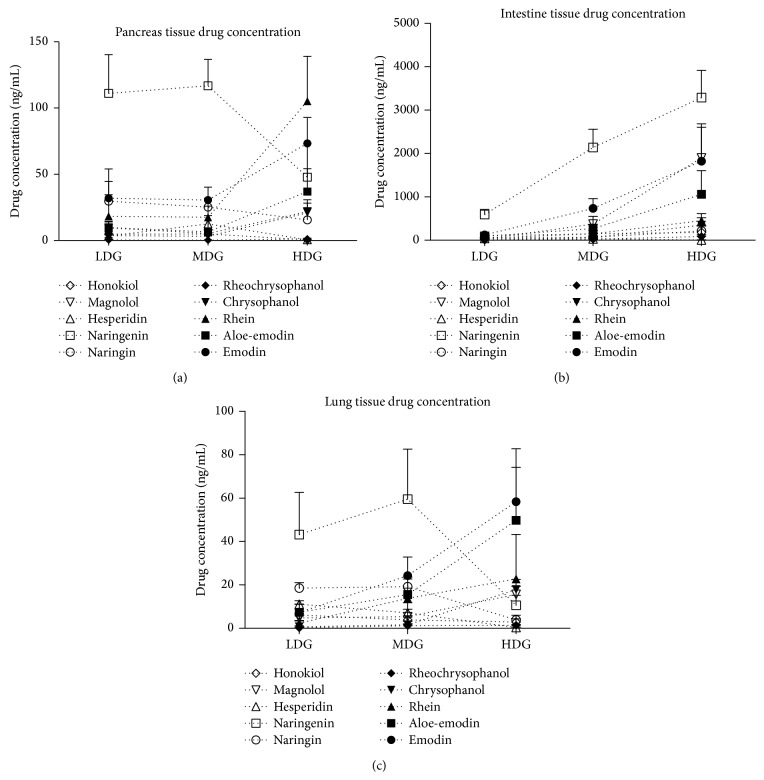
Figure 3.
Distribution of different dose of DCQD in lung, intestine, and pancreas tissues. Normal group = NG, model group = MG, low-dose group = LDG, medium-dose group = MDG, high-dose group = HDG. Rats (n = 6 per group) were given different dose of DCQD (6 g/kg in LDG, 12 g/kg in MDG, and 24 g/kg in HDG by body weight) 2 h after operation. After 24 h, the lung, intestine, and pancreas tissues were collected for examination of drug concentration of DCQD. (a) Drug concentration in pancreas tissues. (b) Drug concentration in intestine tissues. (c) Drug concentration in lung tissues. The results are mean ± SE.

