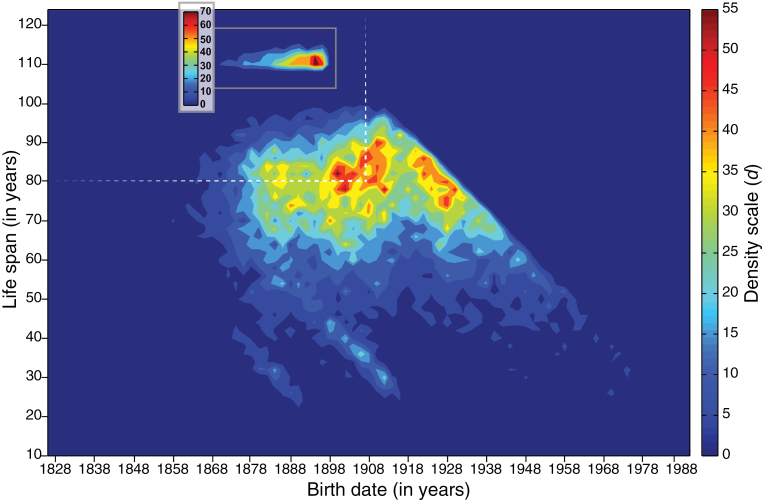
Figure 1.
Life-span (collected in days and represented in years) density of all deceased Olympians (N = 19,012) and all validated supercentenarians (N = 1,205) born since 1800 in function of their birth date (represented in years). Window: X (Olympians) in (1828;1991); Y (Olympians) in [10;123]; X (supercentenarians) in [1828;1897]; and Y (supercentenarians) in [110;123]. The resolution was defined as a = 2 years (see Supplementary Material). The density scale ranges from dark blue illustrating the lowest density values with fewer subjects’ life span to dark red corresponding to the highest density values. The vertical dashed line delimitates the complete cohort, when the population has entirely died out. The horizontal dashed line delimits life span values superior to 80 years within the complete cohort. Isolated life spans are not represented in the figure because of their small density values.

