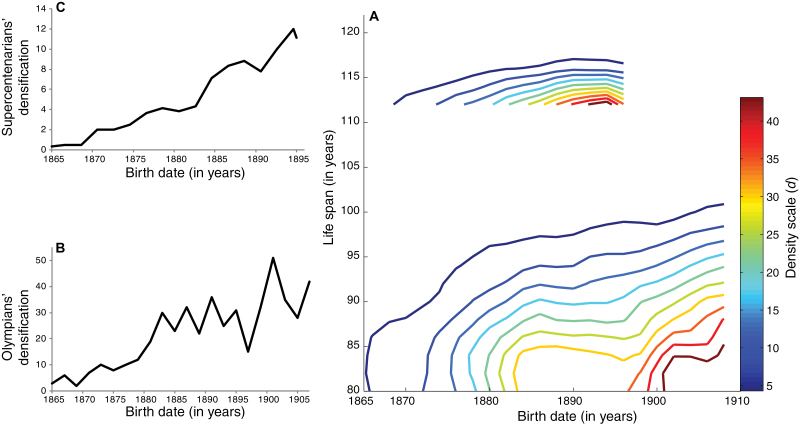
Figure 2.
(A) Contour of the life-span density layers of Olympians and supercentenarians. Selected window: X (Olympians) in [1865;1906] (first year forming a density layer up to the last year of a complete cohort); Y (Olympians) in [80;123]; and X (supercentenarians) in [1865;1897]; Y (supercentenarians) in [110;123]. (B) Olympians’ densification phenomenon. (C) Supercentenarians’ densification phenomenon. The y-axis in B and C represents the sum of the differences in the Y (life span) direction (Σαj) between the density layers by birth date (see Supplementary Material). Graphs (B) and (C) represent the increase of the density layers with time in the direction of the upper life span values measuring the densification phenomenon.

