. 2015 Jun 26;21(2):131–140. doi: 10.3350/cmh.2015.21.2.131

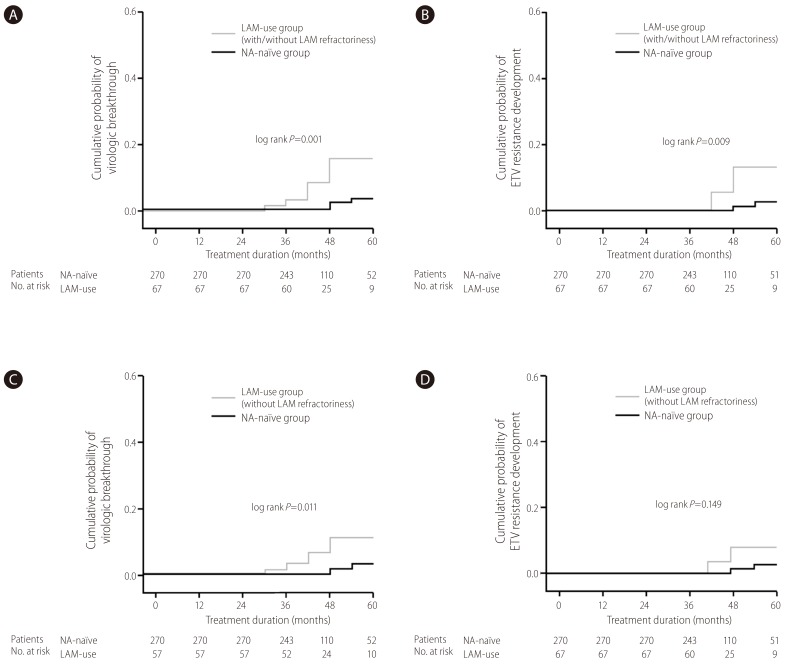
Figure 3. Kaplan-Meier curves for the cumulative probabilities of virological breakthrough and the development of entecavir (ETV) resistance. (A) Comparison of cumulative probabilities of virological breakthrough during ETV treatment between the nucleos(t)ide (NA)-naïve group and lamivudine (LAM)-use group (with or without refractoriness) in all study populations. (B) Comparison of the incidence of ETV resistance between the NA-naïve group and the LAM-use group (with or without refractoriness) in the study population. (C) Comparison of the cumulative probabilities of virological breakthrough during ETV therapy after excluding patients with prior lamivudine experience in the NA-naïve and LAM-use groups. (D) Comparison of the cumulative probabilities of ETV resistance during ETV therapy after excluding patients with prior lamivudine experience in the NA-naïve group and LAM-use group. VB, virologic breakthrough.

Figure 3