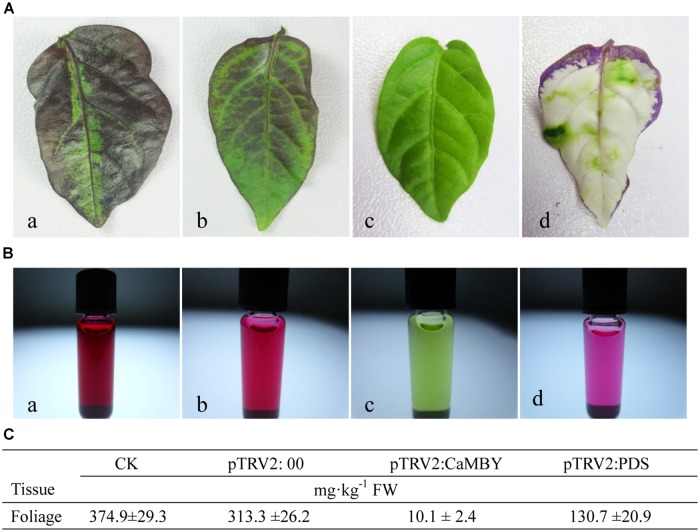
FIGURE 6.
Variation of anthocyanin accumulation in leaves infiltrated with different vectors. (A) Leaves were detached from: a: non-infiltrated control (CK); b: NC plants (PTRV2:00); c: CaMYB-silenced plant (PTRV2: CaMYB); d: PDS-silenced plant (PTRV2: PDS). (B) Extracted solutions from the corresponding four samplings. (C) Anthocyanin content of the four samplings by High-performance liquid chromatography (HPLC). Means ± SD (n = 3).

