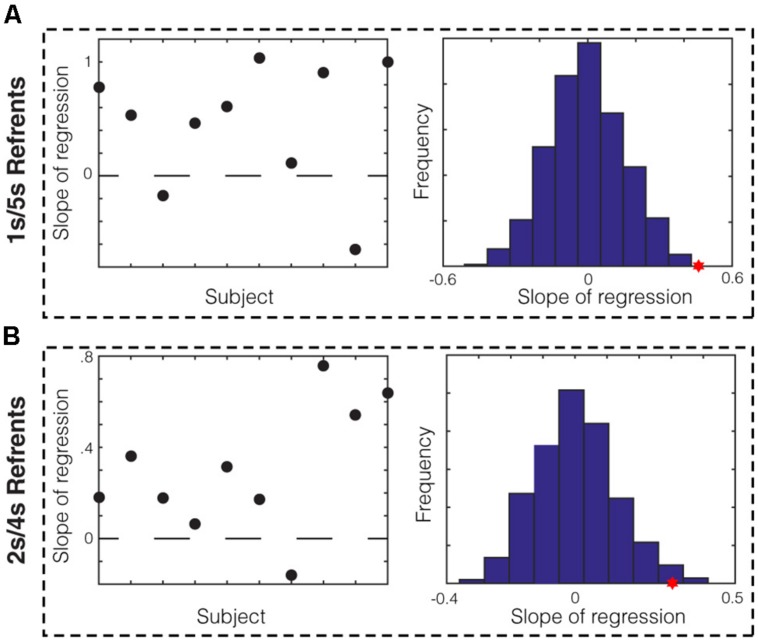
FIGURE 3.
Within-subject analysis of memory bias in production. (A) Slope of regression in the 1/5 s referent group between the mean of the produced referents and the averaged midpoint production per block for each subject. Data from 8/10 subjects show positive slopes. The sampling distribution of slopes was calculated by bootstrapping (right). The average slope for the 1/5 s groups (red star) was significantly higher than the null distribution (p < 0.001). (B) This analysis was repeated for the 2/4 s referent group. Data from 9/10 subjects showed positive slopes and the average slope was significantly higher than that of the null distribution (p = 0.007).

