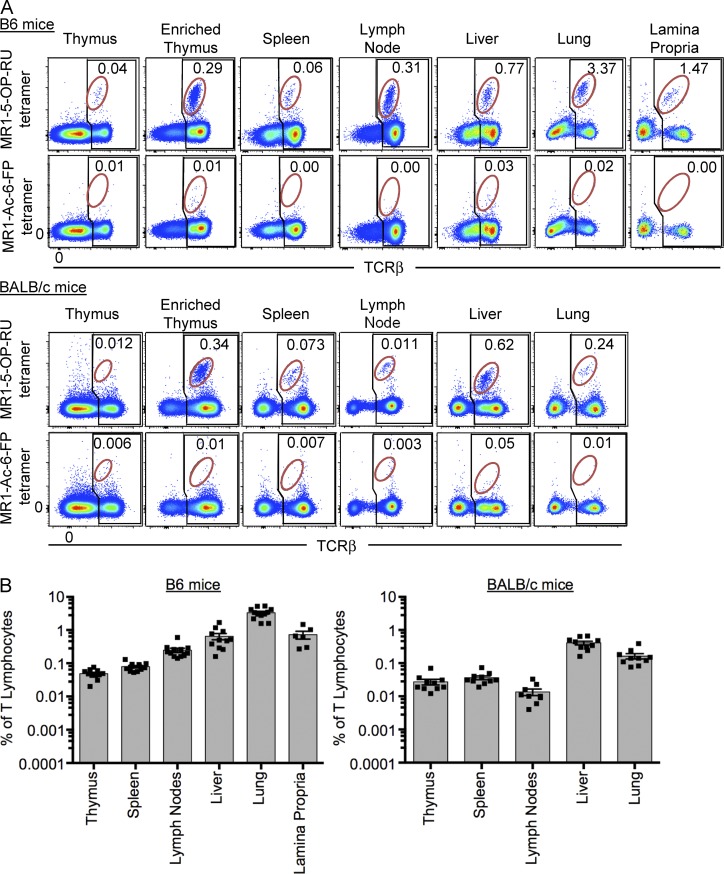
Figure 2.
Tissue distribution of MAIT cells. (A) Flow cytometry analysis of naive mouse thymus, enriched thymus, spleen, lymph nodes (inguinal), liver, lung, and lamina propria, showing reactivity to MR1–5-OP-RU tetramer or MR1–Ac-6-FP tetramer. Plots depict lymphocytes with B220+ B cells excluded by electronic gating. B6 mice are depicted in the top group and BALB/c in the bottom group. Numbers indicate the percentage of MAIT cells (red gate) of total αβ T cells (black gate). (B) Scatter plots depict MAIT cells as a proportion of T lymphocytes in all tissues tested, gated as shown in A. Each symbol represents an individual mouse. Bars depict mean ± SEM, and data are derived from a minimum of three independent experiments for each strain, with a combined total of 6–12 mice per tissue.

