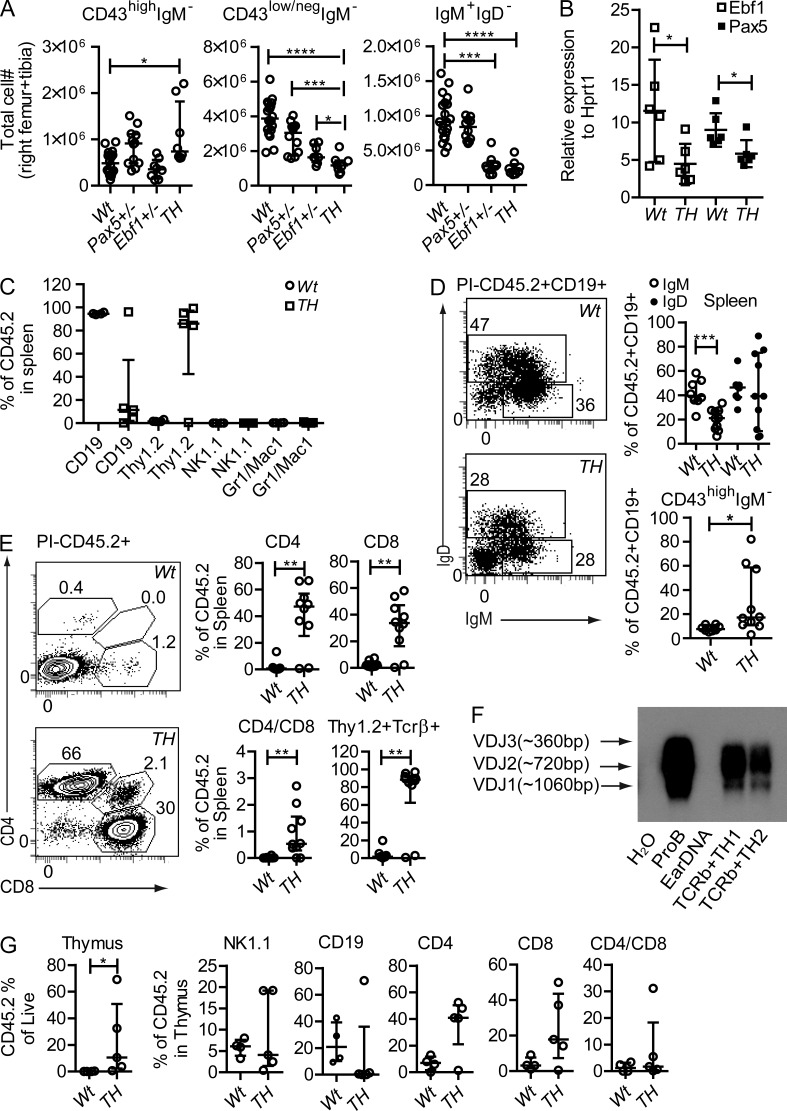
Figure 1.
Combined transheterozygous loss of Pax5 and Ebf1 results in a partial block at the pro–B cell stage and lineage plasticity in CD19+ cells. (A) Graphs displaying the absolute numbers of 7AAD− pro–B cells (Lin−B220+CD19+CD43highIgM−), pre–B cells (Lin−B220+CD19+CD43low/negIgM−), and IgM+ B cells (Lin−B220+CD19+CD43low/negIgM+) in bone marrow from Wt (n = 15), Pax5+/− (n = 10), Ebf1+/− (n = 7), and Pax5+/−Ebf1+/− (TH) (n = 6) mice. (B) Q-PCR analysis of Ebf1 and Pax5 expression in pro–B cells from WT and Pax5+/−Ebf1+/− (TH) mice. Each square indicates a biological replicate analyzed by triplicate Q-PCR reactions. Mean of all mice is presented as a horizontal line. Statistical analysis was performed using unpaired Student’s t test. (C) Graphs illustrating the percent of donor (CD45.2+) of CD19+Thy1.2−, CD19−Thy1.2+, NK1.1+, and Gr1/Mac1+ cells in spleen of Rag1−/− CD45.1+ recipient mice 6–9 wk after transplantation with 2 × 10⁶ sorted bone marrow CD19+IgM− cells from Wt (n = 8) or Pax5+/−Ebf1+/− (TH; n = 9) mice. Mice were from two independent transplantation experiments (4 Wt and 4 TH in experiment one and 4 Wt and 5 TH transplantations in experiment two). (D) Graphs and representative FACS plot illustrating the percent of IgM+, IgM+IgD+, and CD43highIgM− pro–B cells out of CD45.2+CD19+ from Rag1−/− mice as described in A. (E) Diagrams and representative FACS plot illustrating the percent of donor (CD45.2+) of CD4+CD8−, CD4−CD8+, CD4+CD8+, and Thy1.2+Tcrβ+ cells in the spleen of Rag1−/− mice. (F) Southern blot of generated PCR products analyzing immunoglobulin heavy chain VDJ recombination using genomic DNA from Wt pro–B, mouse ear, or sorted TCRβ+ cells from TH transplanted Rag1−/− mice. (G) Diagrams illustrating total CD45.2+ out of live cells in thymus, also the percent of donor (CD45.2+) of CD19+, NK1.1+, CD4+CD8−, CD4−CD8+, and CD4+CD8+ in the thymus of Rag1−/− mice as described in A. In A, C, E, and G, each open circle/square represents one mouse (Wt, n = 4; TH, n = 5) and the data are presented as median (horizontal line) ± interquartile range. Statistical analysis was performed using Mann-Whitney U test. *, P < 0.05; **, P < 0.01; ***, P < 0.001; ****, P < 0.0001.

