Figure 2.
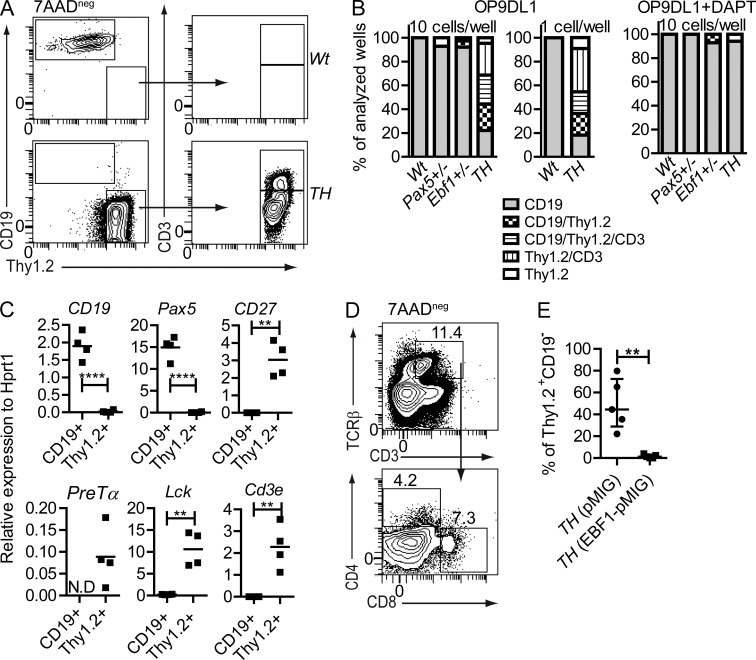
Combined heterozygous loss of Pax5 and Ebf1 results in Notch-dependent lineage plasticity in pro–B cells at the single cell level. (A) Representative FACS plots of sorted Wt and Pax5+/−Ebf1+/− pro–B cells after 14 d of T cell–inducing co-culture on OP9-DL1 stroma cells. (B) Cellular composition of clones from 10 Wt, Pax5+/−, Ebf1+/−, or Pax5+/Ebf1+/− (TH) or single Wt or Pax5+/−Ebf1+/− pro–B cells (Lin−B220+CD19+CD43highIgM−) incubated for 14 d on OP9-DL1 cells to stimulate T cell development, with or without the γ-secretase inhibitor DAPT. Total number of wells analyzed from co-culture of OP9-DL1 and 10 pro–B cells are Wt (51), Pax5+/− (14), Ebf1+/− (38), and Pax5+/−Ebf1+/− (86) and co-culture of OP9-DL1 and one pro–B cell are Wt (12) and Pax5+/−Ebf1+/− (15) collected from 2–3 independent experiments. Similarly, the number of wells analyzed after co-culture of OP9-DL1 and 10 pro–B cells in the presence of DAPT are Wt (21), Pax5+/− (2), Ebf1+/− (14), Pax5+/−Ebf1+/− (17). CD19 cells were scored as CD19+Thy1−CD3−, Thy1 cells as CD19−Thy1+CD3−, and CD3 as CD19−Thy1+CD3+. (C) The graphs display gene expression analyzed by Q-PCR in cultures derived from Wt (4 wells) and Pax5+/−Ebf1+/− (4 wells) after 14 d of T cell–inducing co-culture on OP9-DL1 stroma cells. Each square represents one well, analyzed in triplicate Q-PCR reactions. Mean of all wells is presented as a horizontal line. Statistical analysis was performed using unpaired Student’s t test. N.D = no samples in this group showed detectable expression after 45 cycles of PCR. (D) Representative FACS plot of Pax5+/−Ebf1+/−(TH) CD43highIgM− cells cultivated for 31 d on OP9-DL1 supplied with IL-7, kit ligand, and Flt3 ligand day 0–21. On days 22–31, IL-7 was substituted with IL-2 to further stimulate T cell development. The data are representative of three cultures from two experiments. (E) Dot plots representing the cellular content of cell cultures after transduction with either a pMIG (GFP) control or Ebf1 encoding retrovirus (Ebf1-pMIG) in Pax5+/Ebf1+/− (TH) pro–B cells after 14 d of co-culture with OP9-DL1. The data are collected from pro–B sorted from five different animals. Statistical analysis was performed using unpaired Student’s t test. **, P < 0.01; ****, P < 0.0001.

