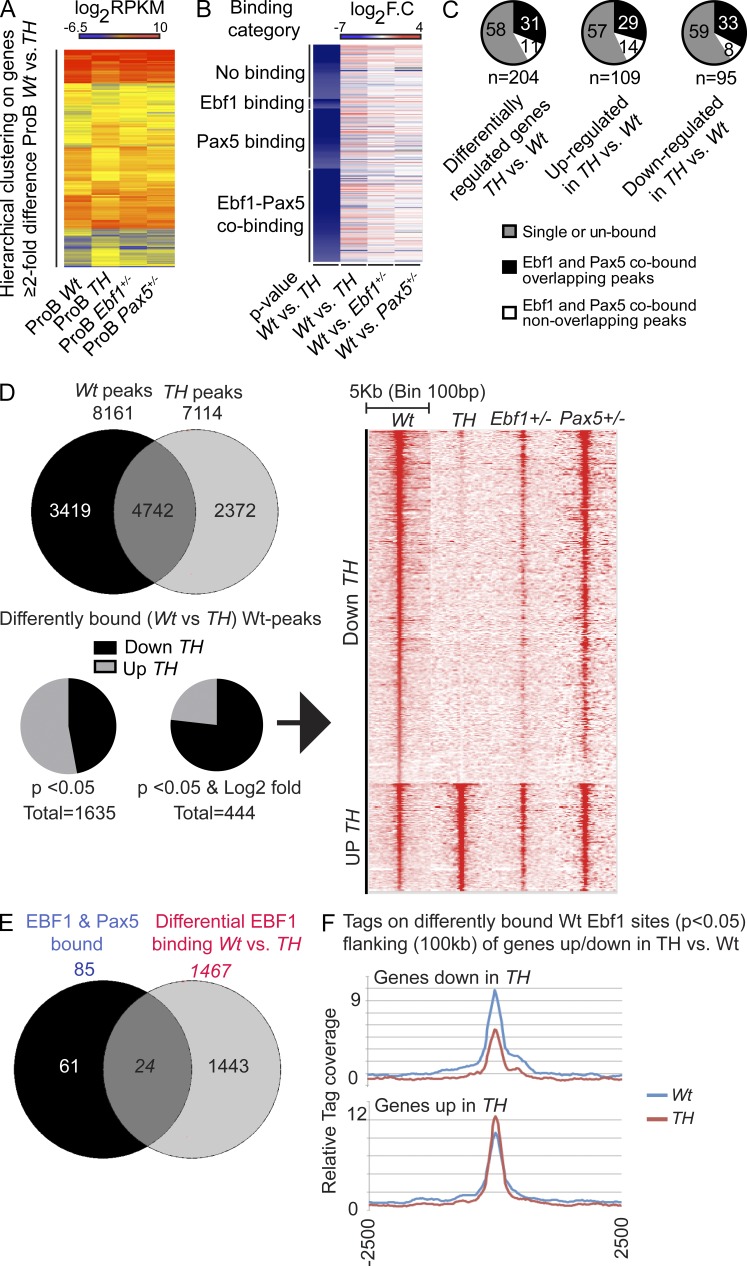
Figure 3.
Combined dose reduction of Ebf1 and Pax5 results in alterations in gene expression patterns and Ebf1 binding but does not result in collapse of the B-lineage transcriptional program. (A) Heatmap of 204 Wt versus TH (Ebf1+/−Pax5+/−) differentially expressed genes in primary ex vivo sorted pro–B cells. Log2 RPKM values of Wt (n = 4), TH (n = 4), Ebf1+/− (n = 2), and Pax5+/− (n = 2), respectively, are displayed. Differentially expressed genes have been hierarchically clustered with the Cluster 3.0 software (Euclidean distance with average linkage). (B) Heatmap of 204 Wt versus TH differentially expressed genes in primary sorted probe cells. Log2 fold-changes between Wt (n = 4) and TH (n = 4), Wt and Ebf1+/− (n = 2), Wt and Pax5+/− (n = 2), respectively, are displayed. Differentially expressed genes have been clustered on Ebf1+/− and Pax5+/− (Revilla-I-Domingo et al., 2012; Vilagos et al., 2012) binding categories and sorted after increasing P values (top to bottom) as defined by Student’s t test (Benjamini-Hoeschberg corrected) for TH versus Wt differential gene expression. (C) Pie-charts displaying overlapping and nonoverlapping Ebf1+/− and Pax5+/− peaks (Revilla-I-Domingo et al., 2012; Vilagos et al., 2012) in the 204 TH versus Wt differentially regulated genes, as well as the 109 up-regulated and 95 down-regulated genes. Numbers in the pie-charts are percent of total peaks in each group. (D) Venn diagram representing the total number of differentially and shared Ebf1 bound sites determined by ChIP-seq analysis of Wt and TH pro–B cells. The bottom pie-charts represent the number of peaks detected in Wt cells displaying statistically significant changed binding in TH cells and the number of sites with P < 0.05 and fourfold of differentially bound Ebf1 peaks (444 peaks in total). Chromosomes X, Y, M, and Random were filtered out from the Wt and TH peak lists before analysis. The heatmap shows Ebf1 binding on the 444 peaks differentially bound in TH centered on the Wt Ebf1 peaks with a window of 5-kb and a bin size of 100 bp. Data were collected from two independent experiments from each genotype. (E) A list of genes (1467) closest to the 1635 differentially bound (P < 0.05) Ebf1 peaks was compared with the list of genes that are differentially expressed between Wt and TH and co-bound by both Pax5 and Ebf1 as defined by ChIP seq from (Revilla-I-Domingo et al., 2012; Vilagos et al., 2012). (F) Tags from Ebf1 ChIP-seq in Wt and TH samples were plotted centered on peaks defined by the P < 0.05 differentially bound peak list, found within 100 kb of genes that were up or down-regulated in TH versus Wt as indicated.

