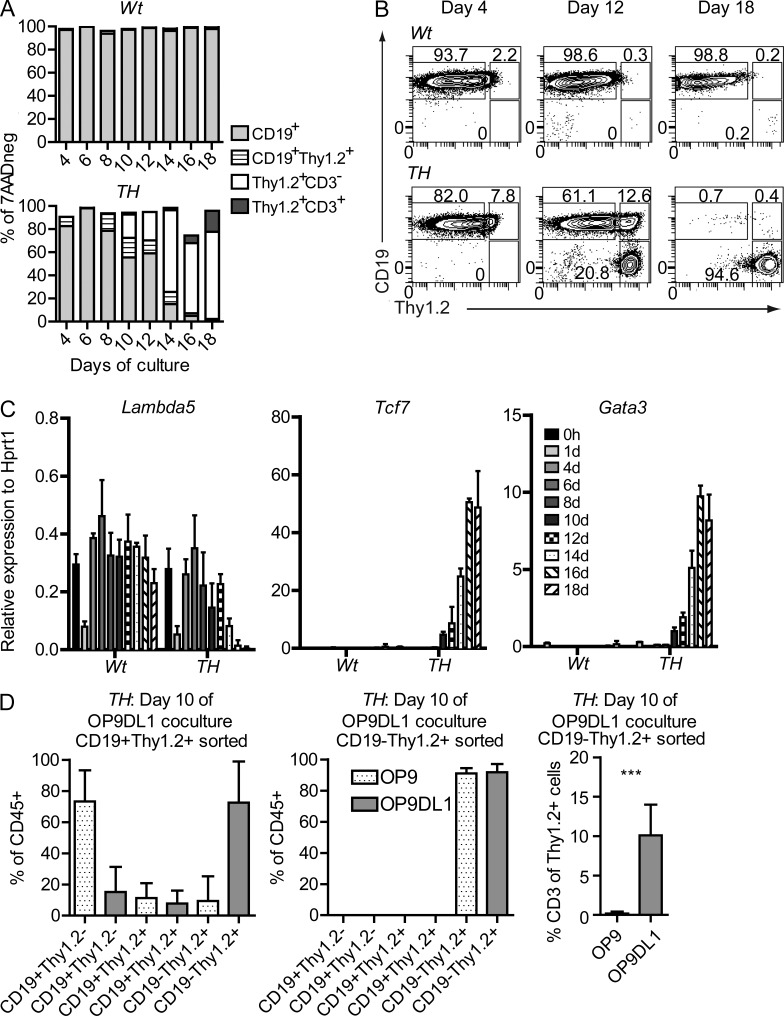
Figure 4.
Pax5+/−Ebf1+/− pro–B cells undergo lineage conversion into T cells via a bivalent state. (A) Bars describe the expression change of surface markers CD19, Thy1.2, and CD3 d 4–18 after that freshly sorted Lin−B220+CD19+CD43highIgM− Wt of Pax5+/−Ebf1+/−were placed on OP9-DL1 (day 0) stroma cells under conditions permissive for T cell development. 1,000,000 cells were sorted from 2 Pax5+/−Ebf1+/− (TH) and 2 Wt animals, which were further divided into 2 replicates per mouse before plating onto OP9-DL1. (B) Representative FACS plots of CD19 and Thy1.2 surface expression at days 4, 12, and 18 d after seeding onto OP9-DL1 as explained in A. (C) Changes of relative gene expression of Lambda5, Tcf7, and Gata3 0–18 d after Lin−B220+CD19+CD43highIgM− Wt or Pax5+/−Ebf1+/− (TH) were placed on OP9-DL1. Data are shown as median expression levels relative to Hprt1 from four samples analyzed in triplicate Q-PCR reactions (two of each genotype in duplicate). Error bars describe interquartile range. (D) Diagrams describing the percentage CD19+Thy1.2−, CD19+Thy1.2+, or CD19−Thy1.2+ of total CD45+ cells in OP9 (dotted bars) or OP9-DL1 (gray bars) co-cultures from sorted CD19+Thy1.2+ or CD19−Thy1.2+ cells generated by preincubation of primary sorted Pax5+/−Ebf1+/− (TH) pro–B cells on OP9-DL1 for 10 d. The experiment is based on independently sorted cells from two mice and analysis of a total of six co-cultures for each condition. ***, P < 0.001.

