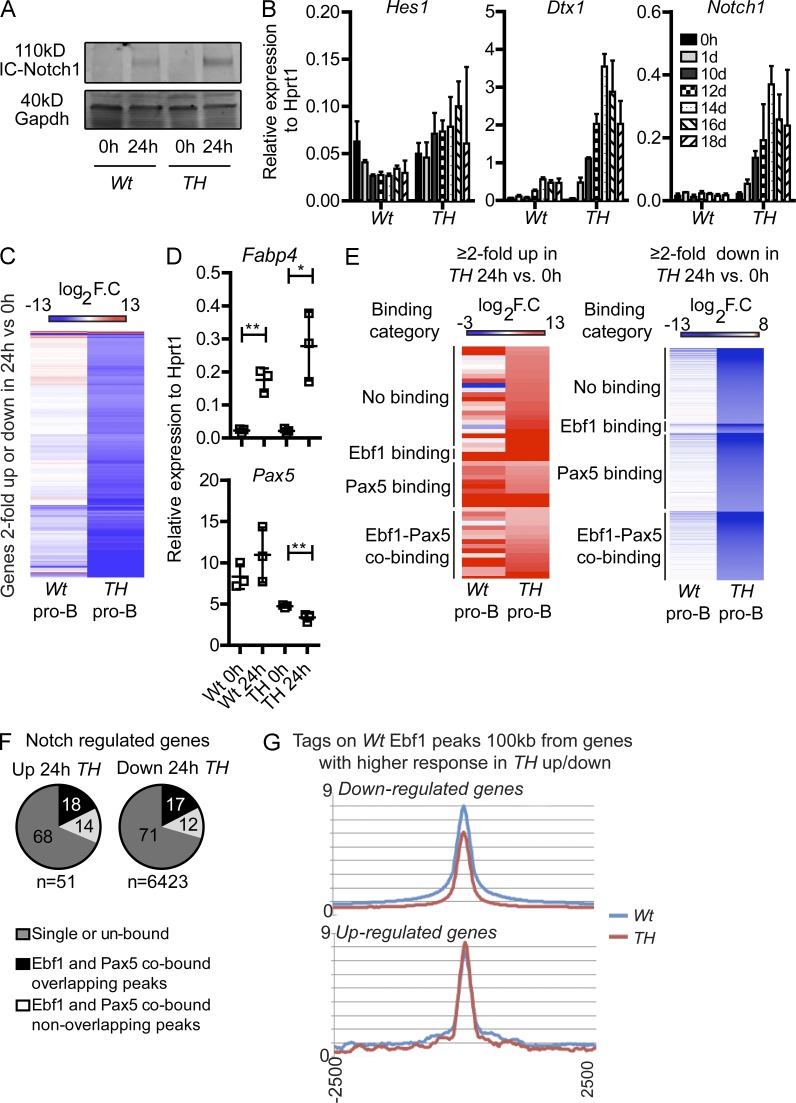
Figure 5.
The cellular response to Notch signaling is altered in pro–B cells carrying combined dose reduction of Ebf1 and Pax5. (A) The levels of intracellular Notch1 determined with Western blot 0 and 24 h after exposure to OP9-DL1 cells. The experiment was performed in triplicate and GAPDH was used as a loading control. (B) Q-PCR detecting changes of relative gene expression of Deltex1, Notch1, and Hes1 0–18 d after CD43highIgM− Pax5+/−Ebf1+/− (TH) or CD43highIgM− Wt were placed on OP9-DL1. Data are shown as median expression levels relative to Hprt1 from four samples analyzed in triplicate Q-PCR reactions (two of each genotype in duplicate). Error bars describe interquartile range. (C) Heatmap of log2 fold change gene expression values in Wt (n = 4) and TH (n = 4) pro–B cells displaying 6,474 genes with expression over 0.5 RPKM linear scale and a 2-fold change in expression in TH cells after 24 h of exposure to OP9-DL1. Hierarchical clustering was performed with the Cluster 3.0 software (Euclidean distance with average linkage). (D) Q-PCR detecting changes of relative gene expression of Fabp4 and Pax5 24 h after that CD19+CD43highIgM− WT or Pax5+/−Ebf1+/− (TH) cells expanded in OP9 cultures were reseeded on OP9-DL1 cells. Data are shown as median expression levels relative to Hprt1 from three independent samples analyzed in triplicate Q-PCR reactions. Error bars describe interquartile range. (E) Heatmaps of Wt and TH samples on genes with differential expression in TH (24 vs. 0 h on OP9-DL1) were grouped according to Ebf1 and Pax5 (Revilla-I-Domingo et al., 2012; Vilagos et al., 2012) binding categories and sorted based on increasing fold change in TH. (left) The genes ≥2-fold in TH 24 versus 0 h; (right) genes ≥2-fold in TH 24 versus 0 h. (F) Overlapping and nonoverlapping Ebf1+/− and Pax5+/− peaks (Revilla-I-Domingo et al., 2012; Vilagos et al., 2012) in the 6,474 TH 24 versus 0 h on OP9-DL1 differentially regulated genes. Numbers in the pie graphs show percent of total peaks. (G) Tags from Ebf1 ChIP-seq in Wt and TH samples were plotted on peak center ± 2,500 bp. Peaks used were derived from the total Wt sample peak list (Chr, X, Y, M, and random are filtered out) and found within 100 kb of genes that had a higher (≥2-fold) response to OP9-DL1 stimuli in TH compared with Wt. *, P < 0.05; **, P < 0.01.

