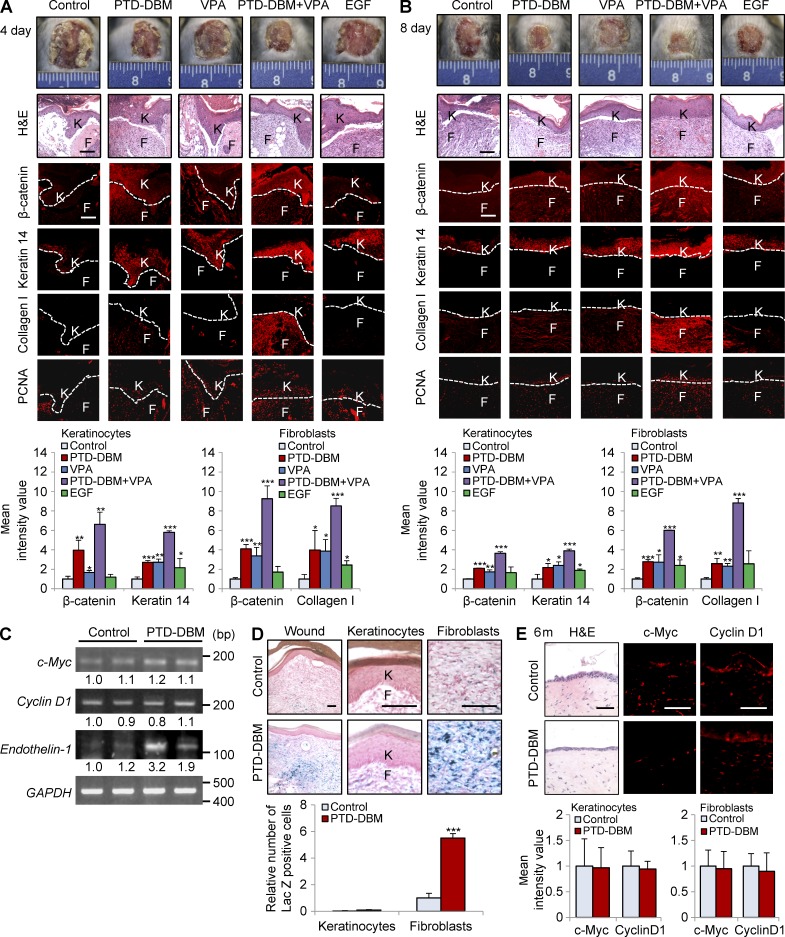
Figure 10.
PTD-DBM induces β-catenin, wound-healing markers, and endothelin-1 during cutaneous wound healing. (A and B, top) Representative images of macroscopic wounds, H&E staining and IHC staining for β-catenin, keratin 14, collagen I, or PCNA in wounds (n = 3 mice group) 4 (A) and 8 d (B) after wounding are shown. Dashed lines demarcate the epidermal–dermal boundary. F, fibroblasts; K, keratinocytes. (bottom) Mean intensity values are presented for keratinocytes (left) and fibroblasts (right; *, P < 0.05; **, P < 0.005; ***, P < 0.0005; n = 3 independent experiments). (C) RT-PCR analysis was performed 12 d after wounding on wounds treated with or without 100 µM PTD-DBM to detect the mRNA levels of CXXC5, endothelin-1, c-Myc, cyclin D1, and GAPDH (n = 2 mice/group). Relative densitometry values are shown underneath the blots. (D, top) Representative images of X-gal staining of wounded tissue from Axin2LacZ/+ mice (n = 3 mice/group) treated with 100 µM PTD-DBM for 11 d and magnified images in epidermal keratinocytes and dermal fibroblasts are shown. (bottom) Relative number of lacZ-positive cells is presented in keratinocytes and fibroblasts (***, P < 0.0005; n = 3 independent experiments). (E) Representative images of H&E staining and IHC staining for c-Myc or cyclin D1 in wounds (n = 3 mice/group) at 6 mo after wounding (top) and mean intensity values are presented for keratinocytes (left) and fibroblasts (right; bottom) are shown (n = 3 independent experiments). Bars: (A, B, and D) 100 µm; (E) 50 µm. Means ± SD.

